GDP & Economic Growth
A comprehensive look at Canadian GDP — aggregate real output growth, provincial breakdowns, industry-level contributions, and structural shifts across sectors. Based on Statistics Canada national accounts data and automatically refreshed.
Overview
Chained Canadian real GDP, monthly, seasonally adjusted
Data through Q1 2026
Overview 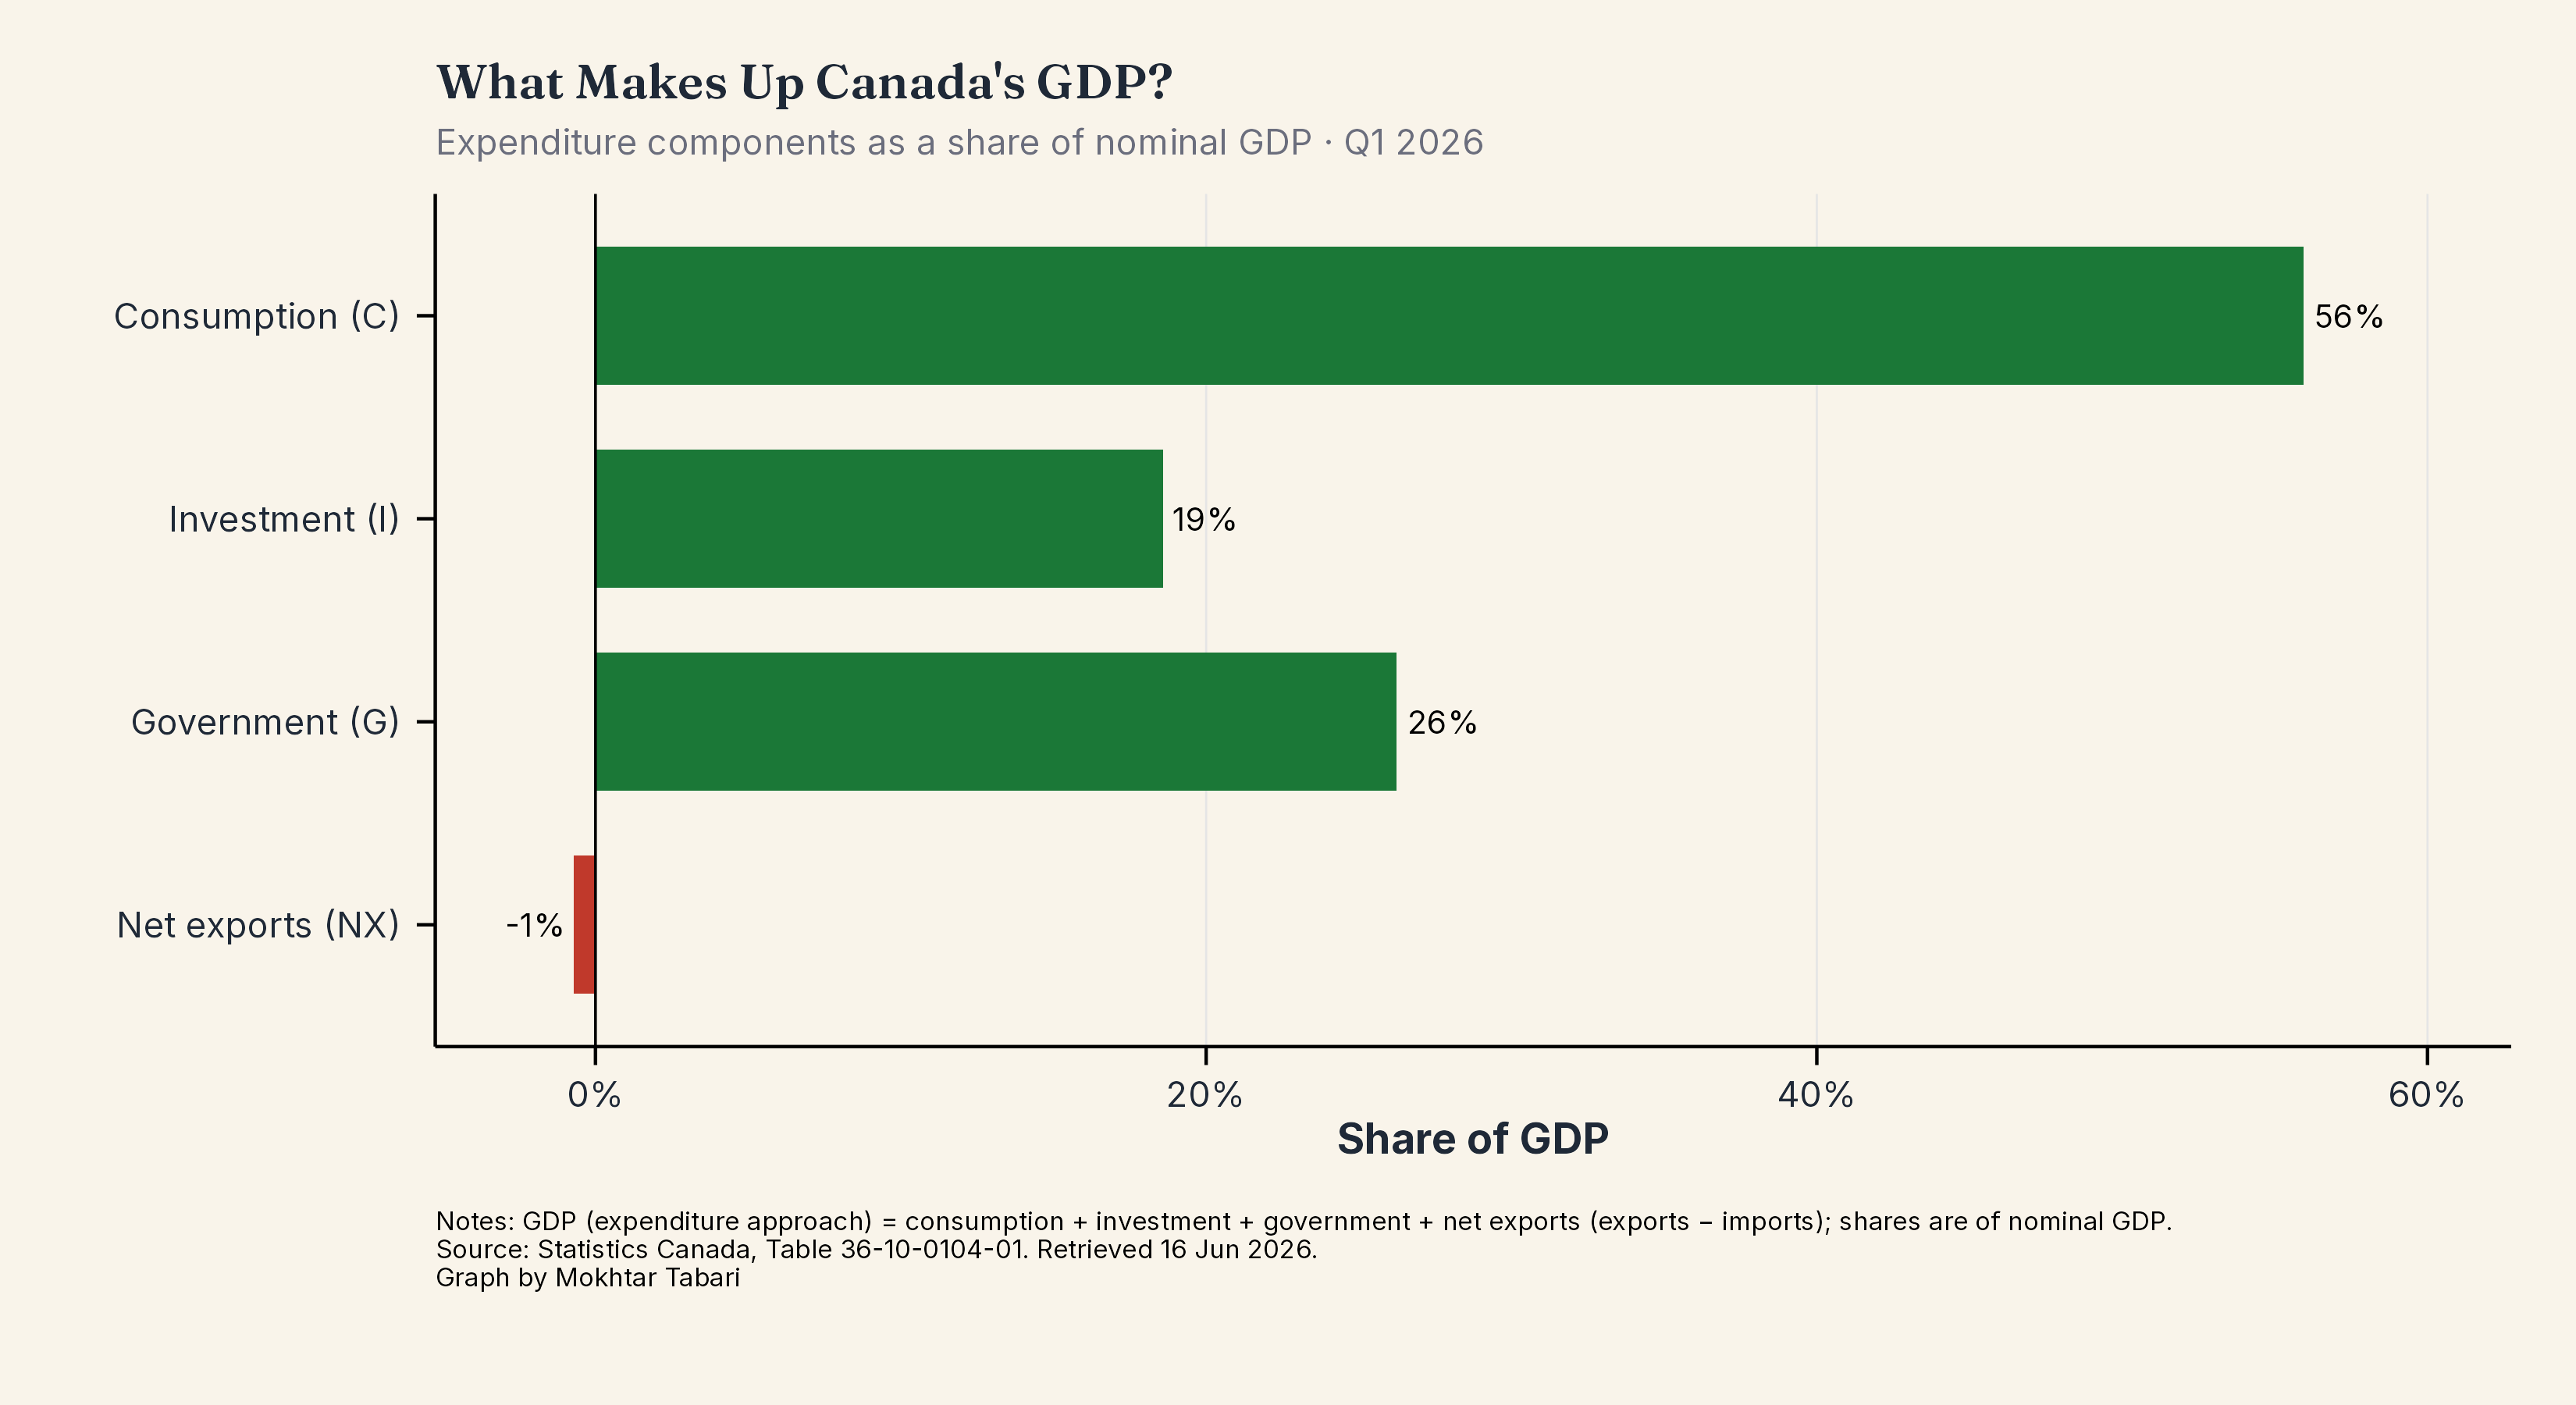
Expenditure components as a share of nominal GDP, latest quarter
Data through Jan 2026
Overview Per Capita
Output per Canadian, quarterly, chained dollars
Data through Q1 2026
Per Capita Provincial
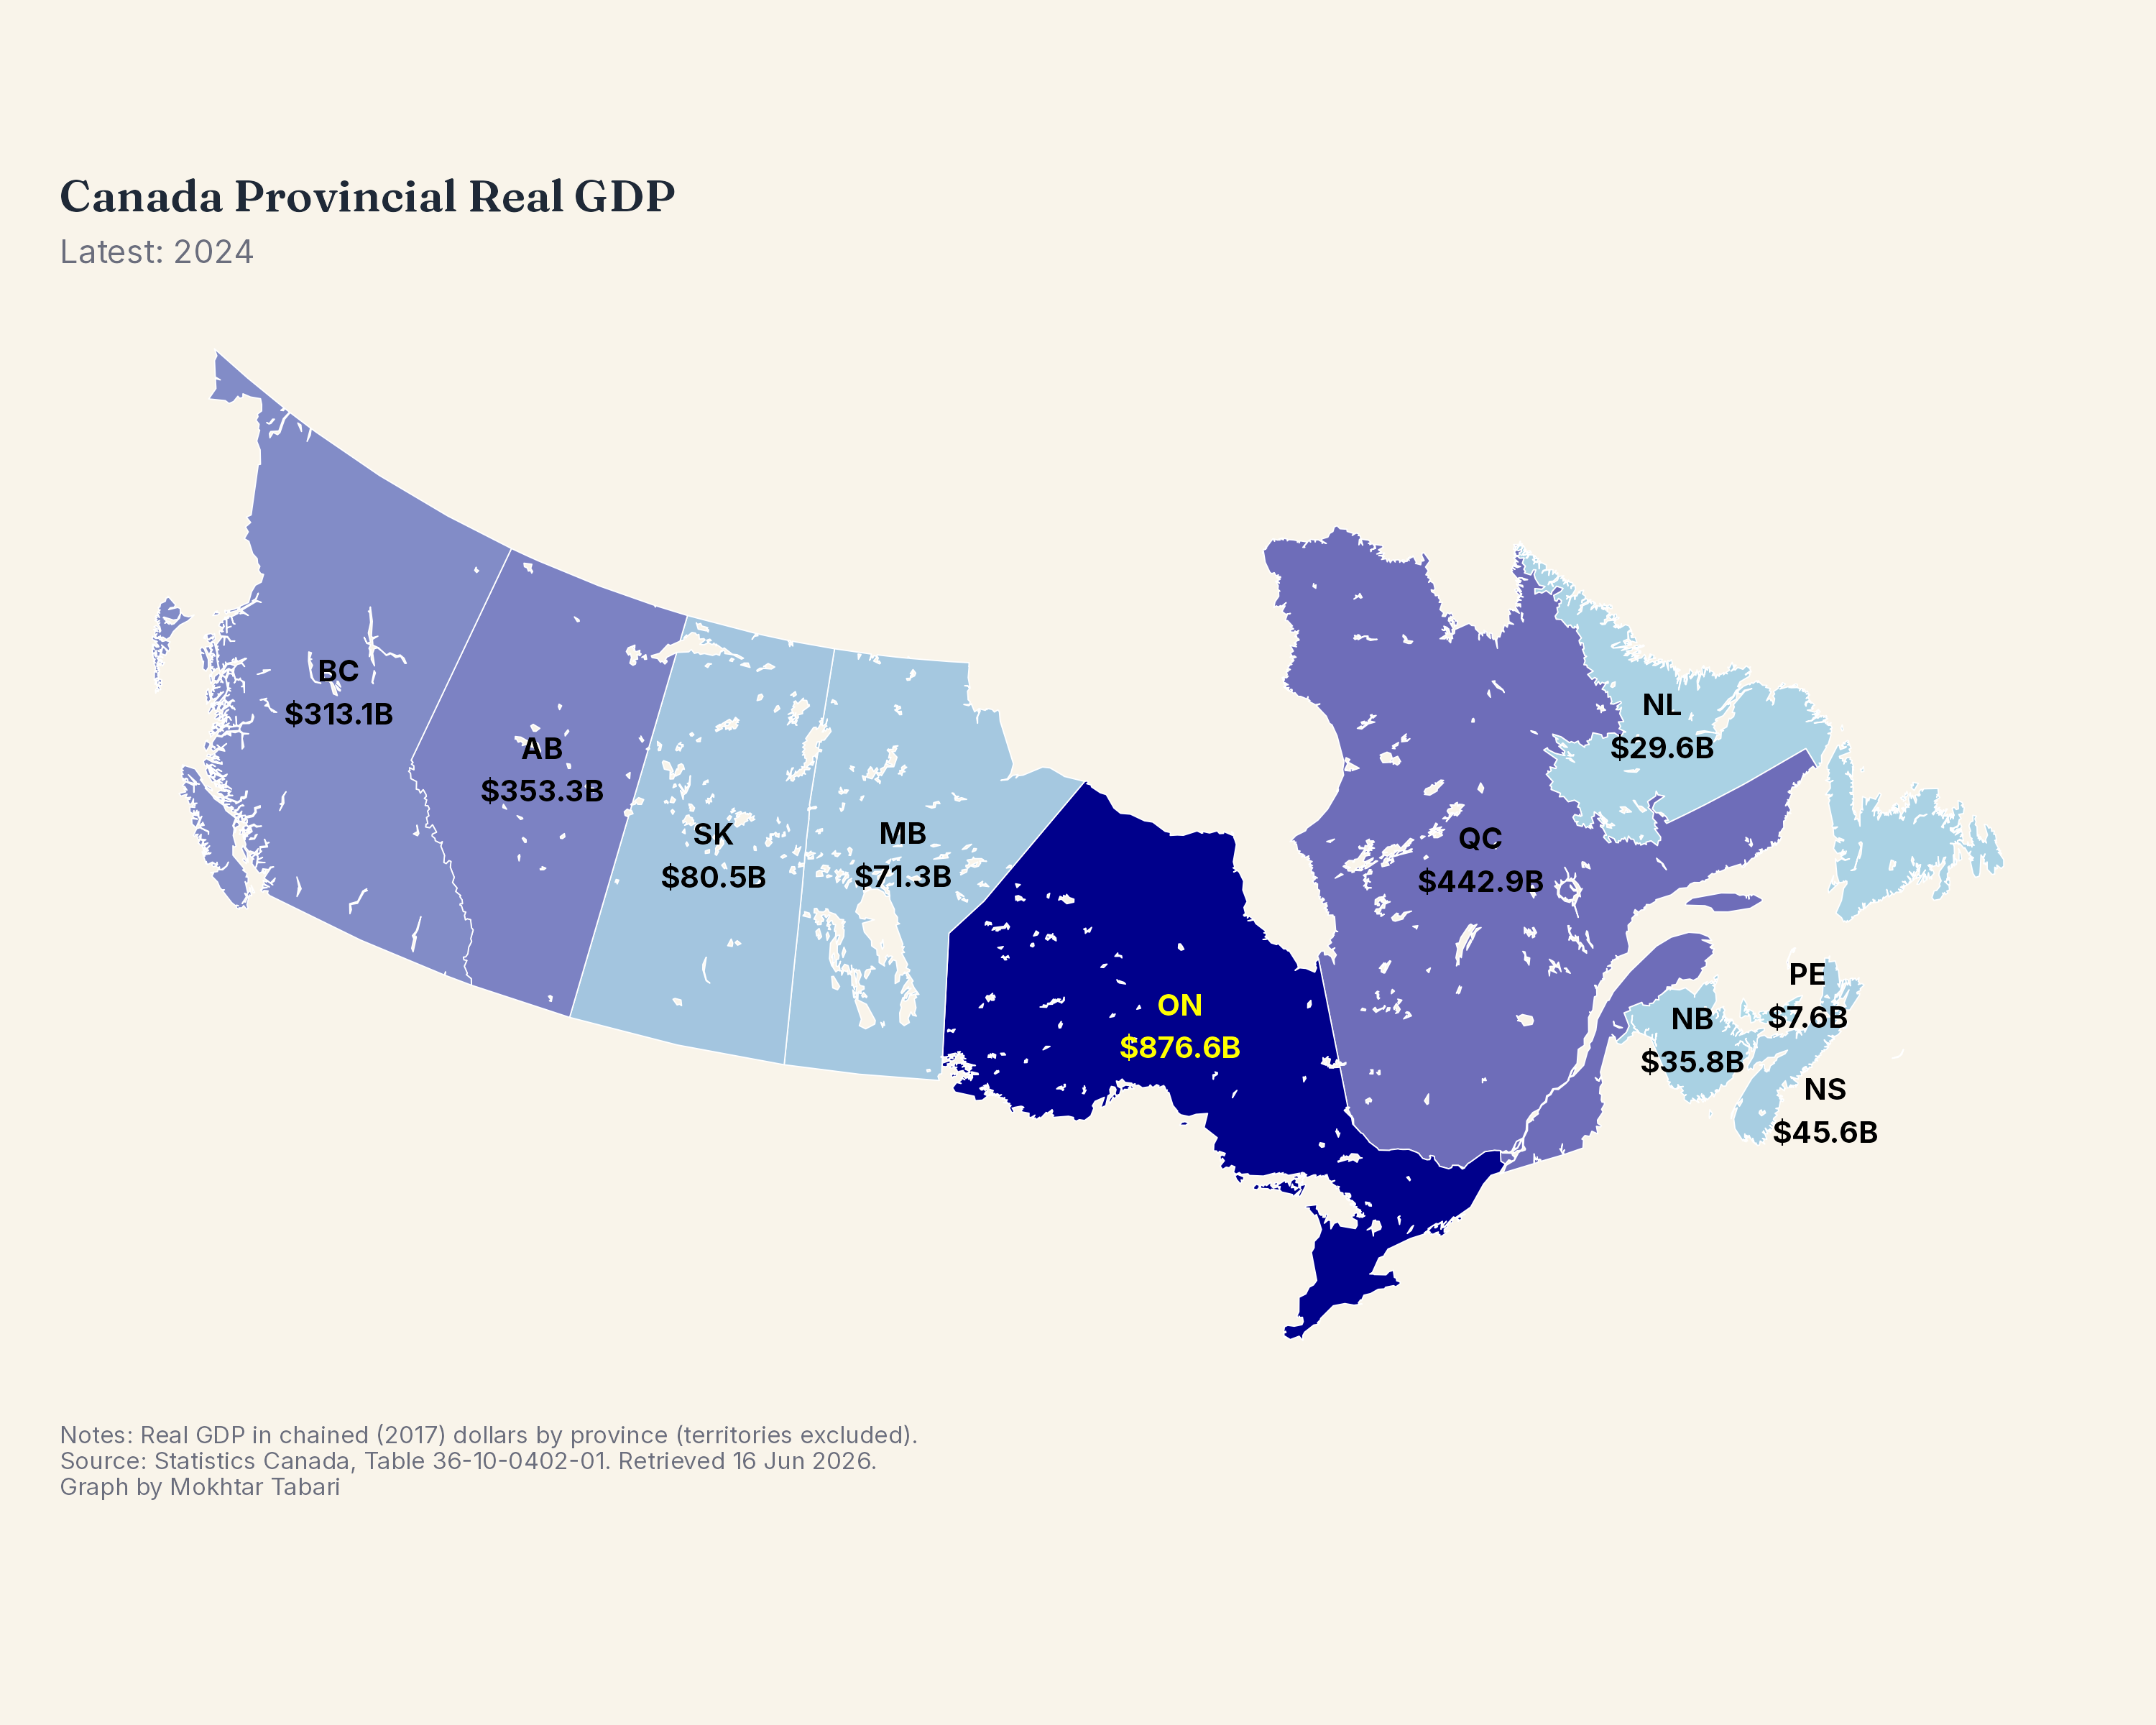
Provincial real GDP levels mapped across Canada
Data through Mar 2026
Provincial 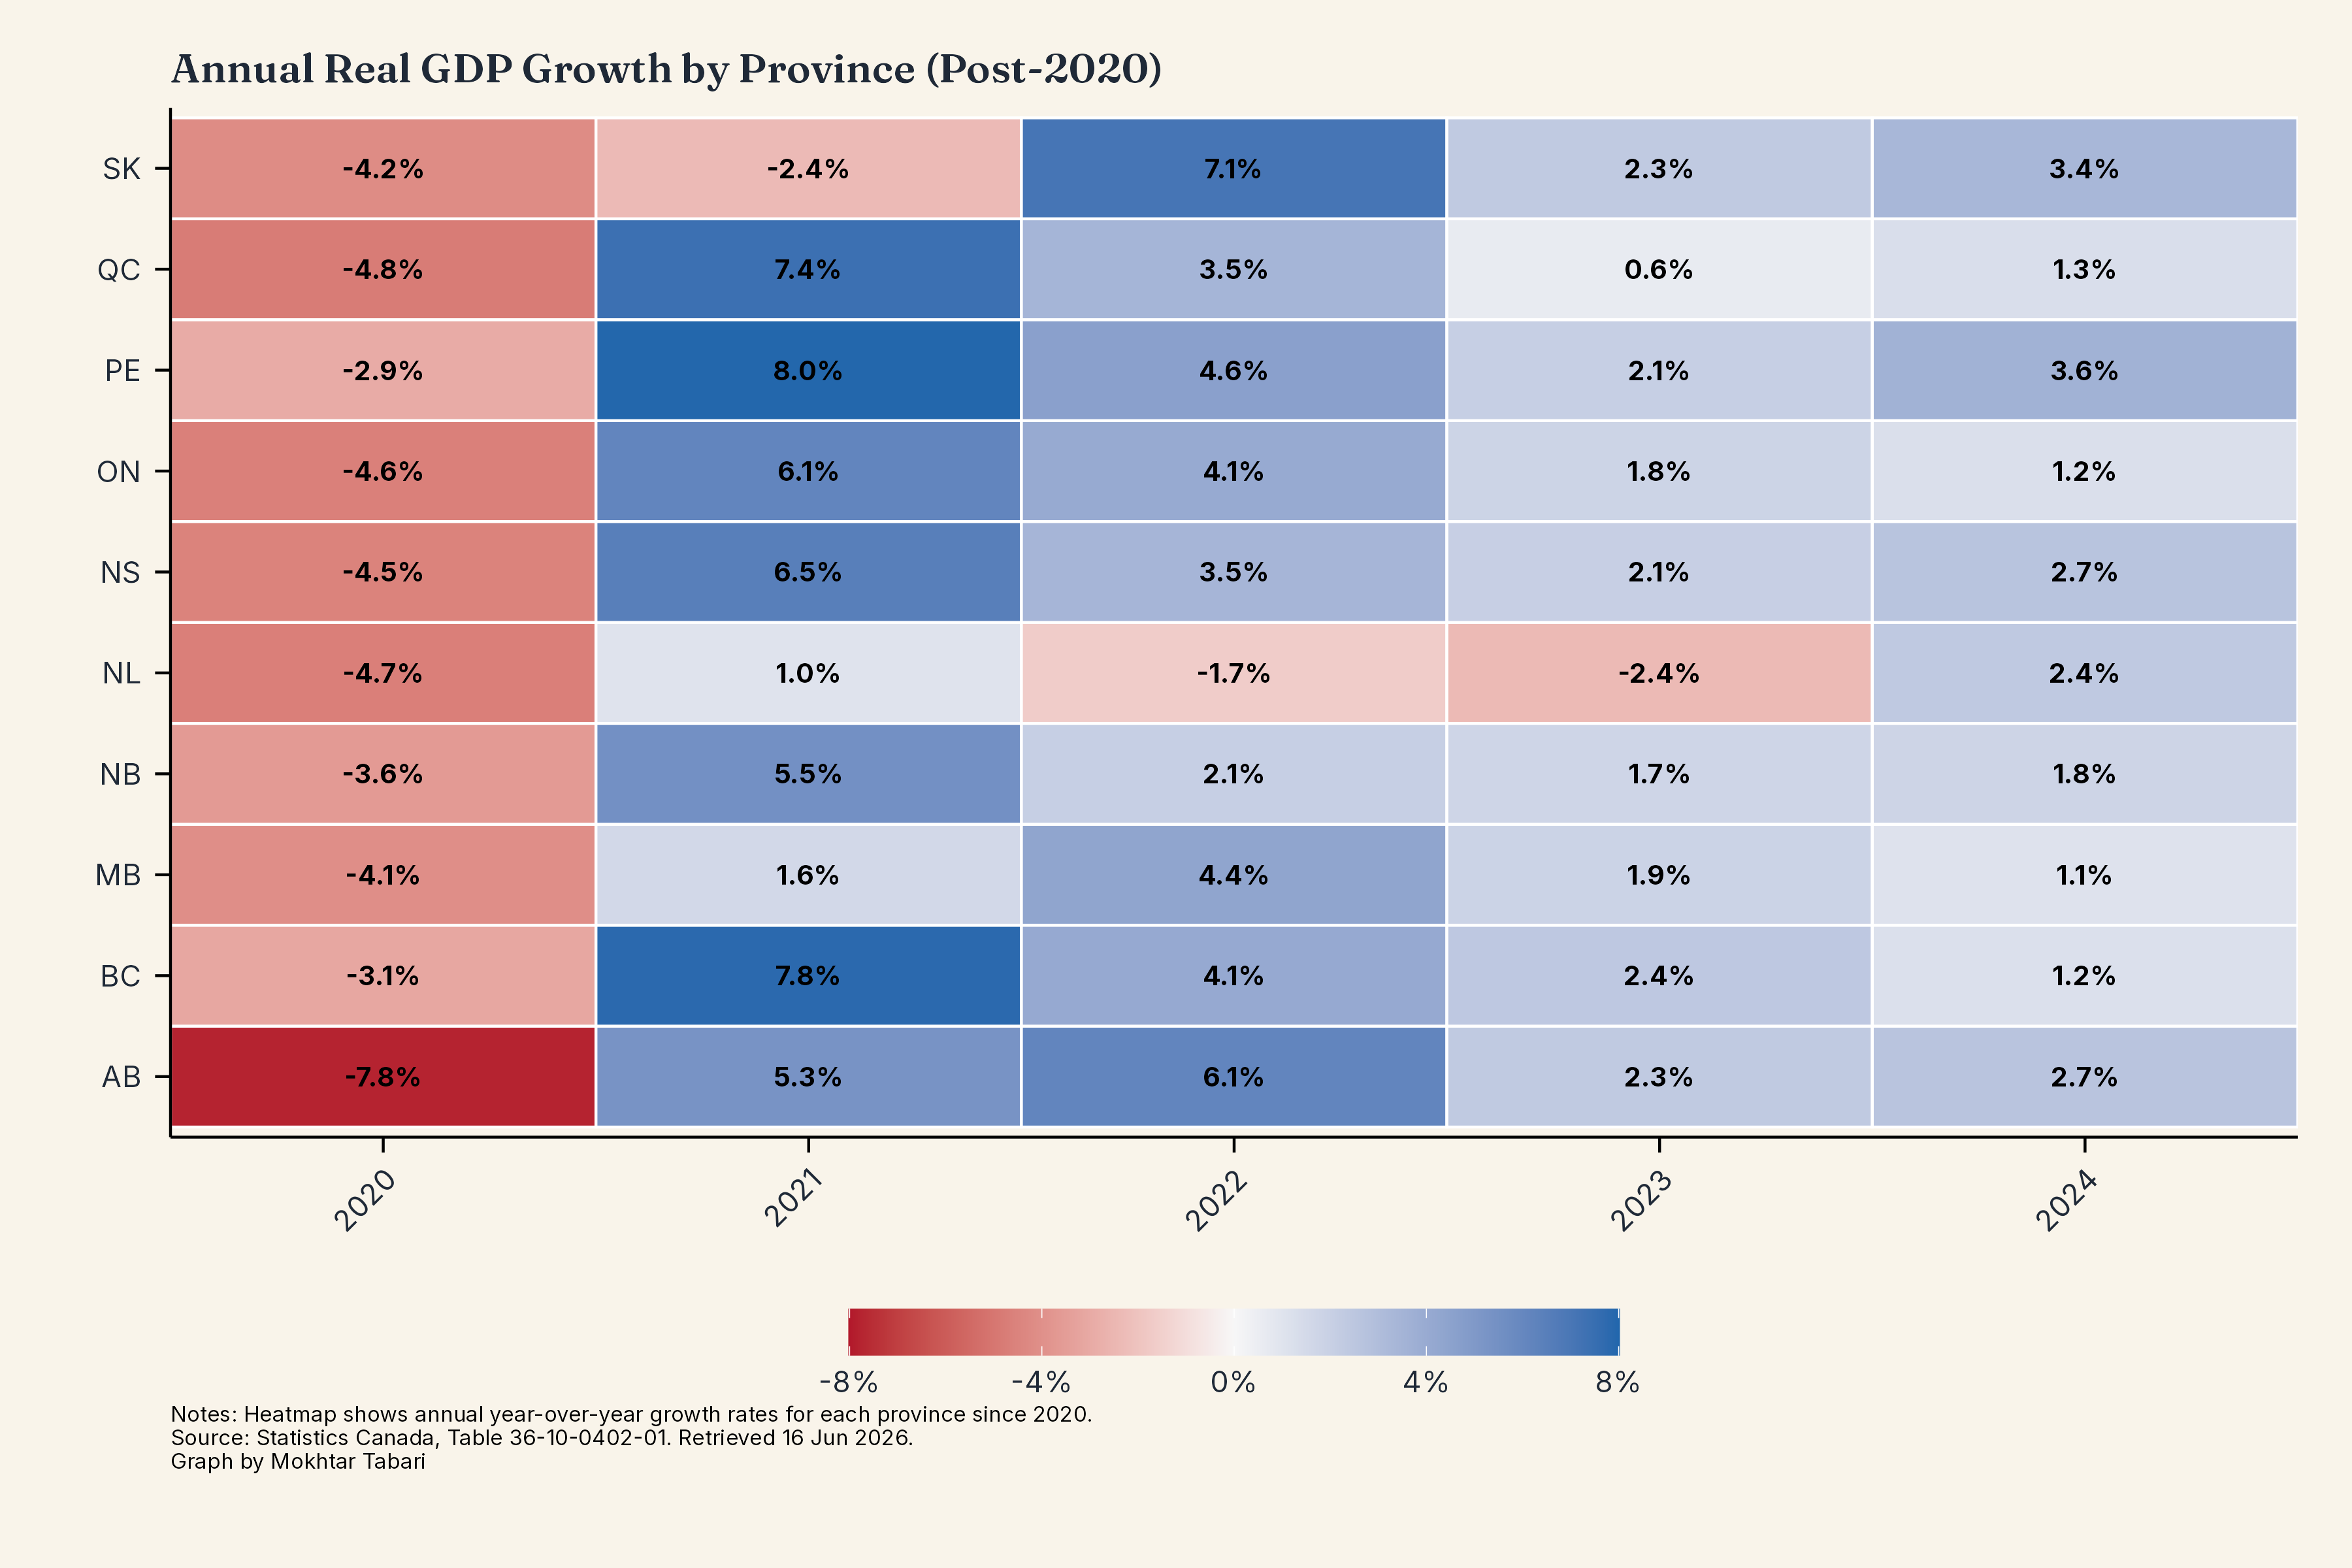
Month-by-month real GDP growth across provinces, colour-coded
Data through 2024
Provincial Real GDP growth rates across provinces
Data through 2024
Provincial 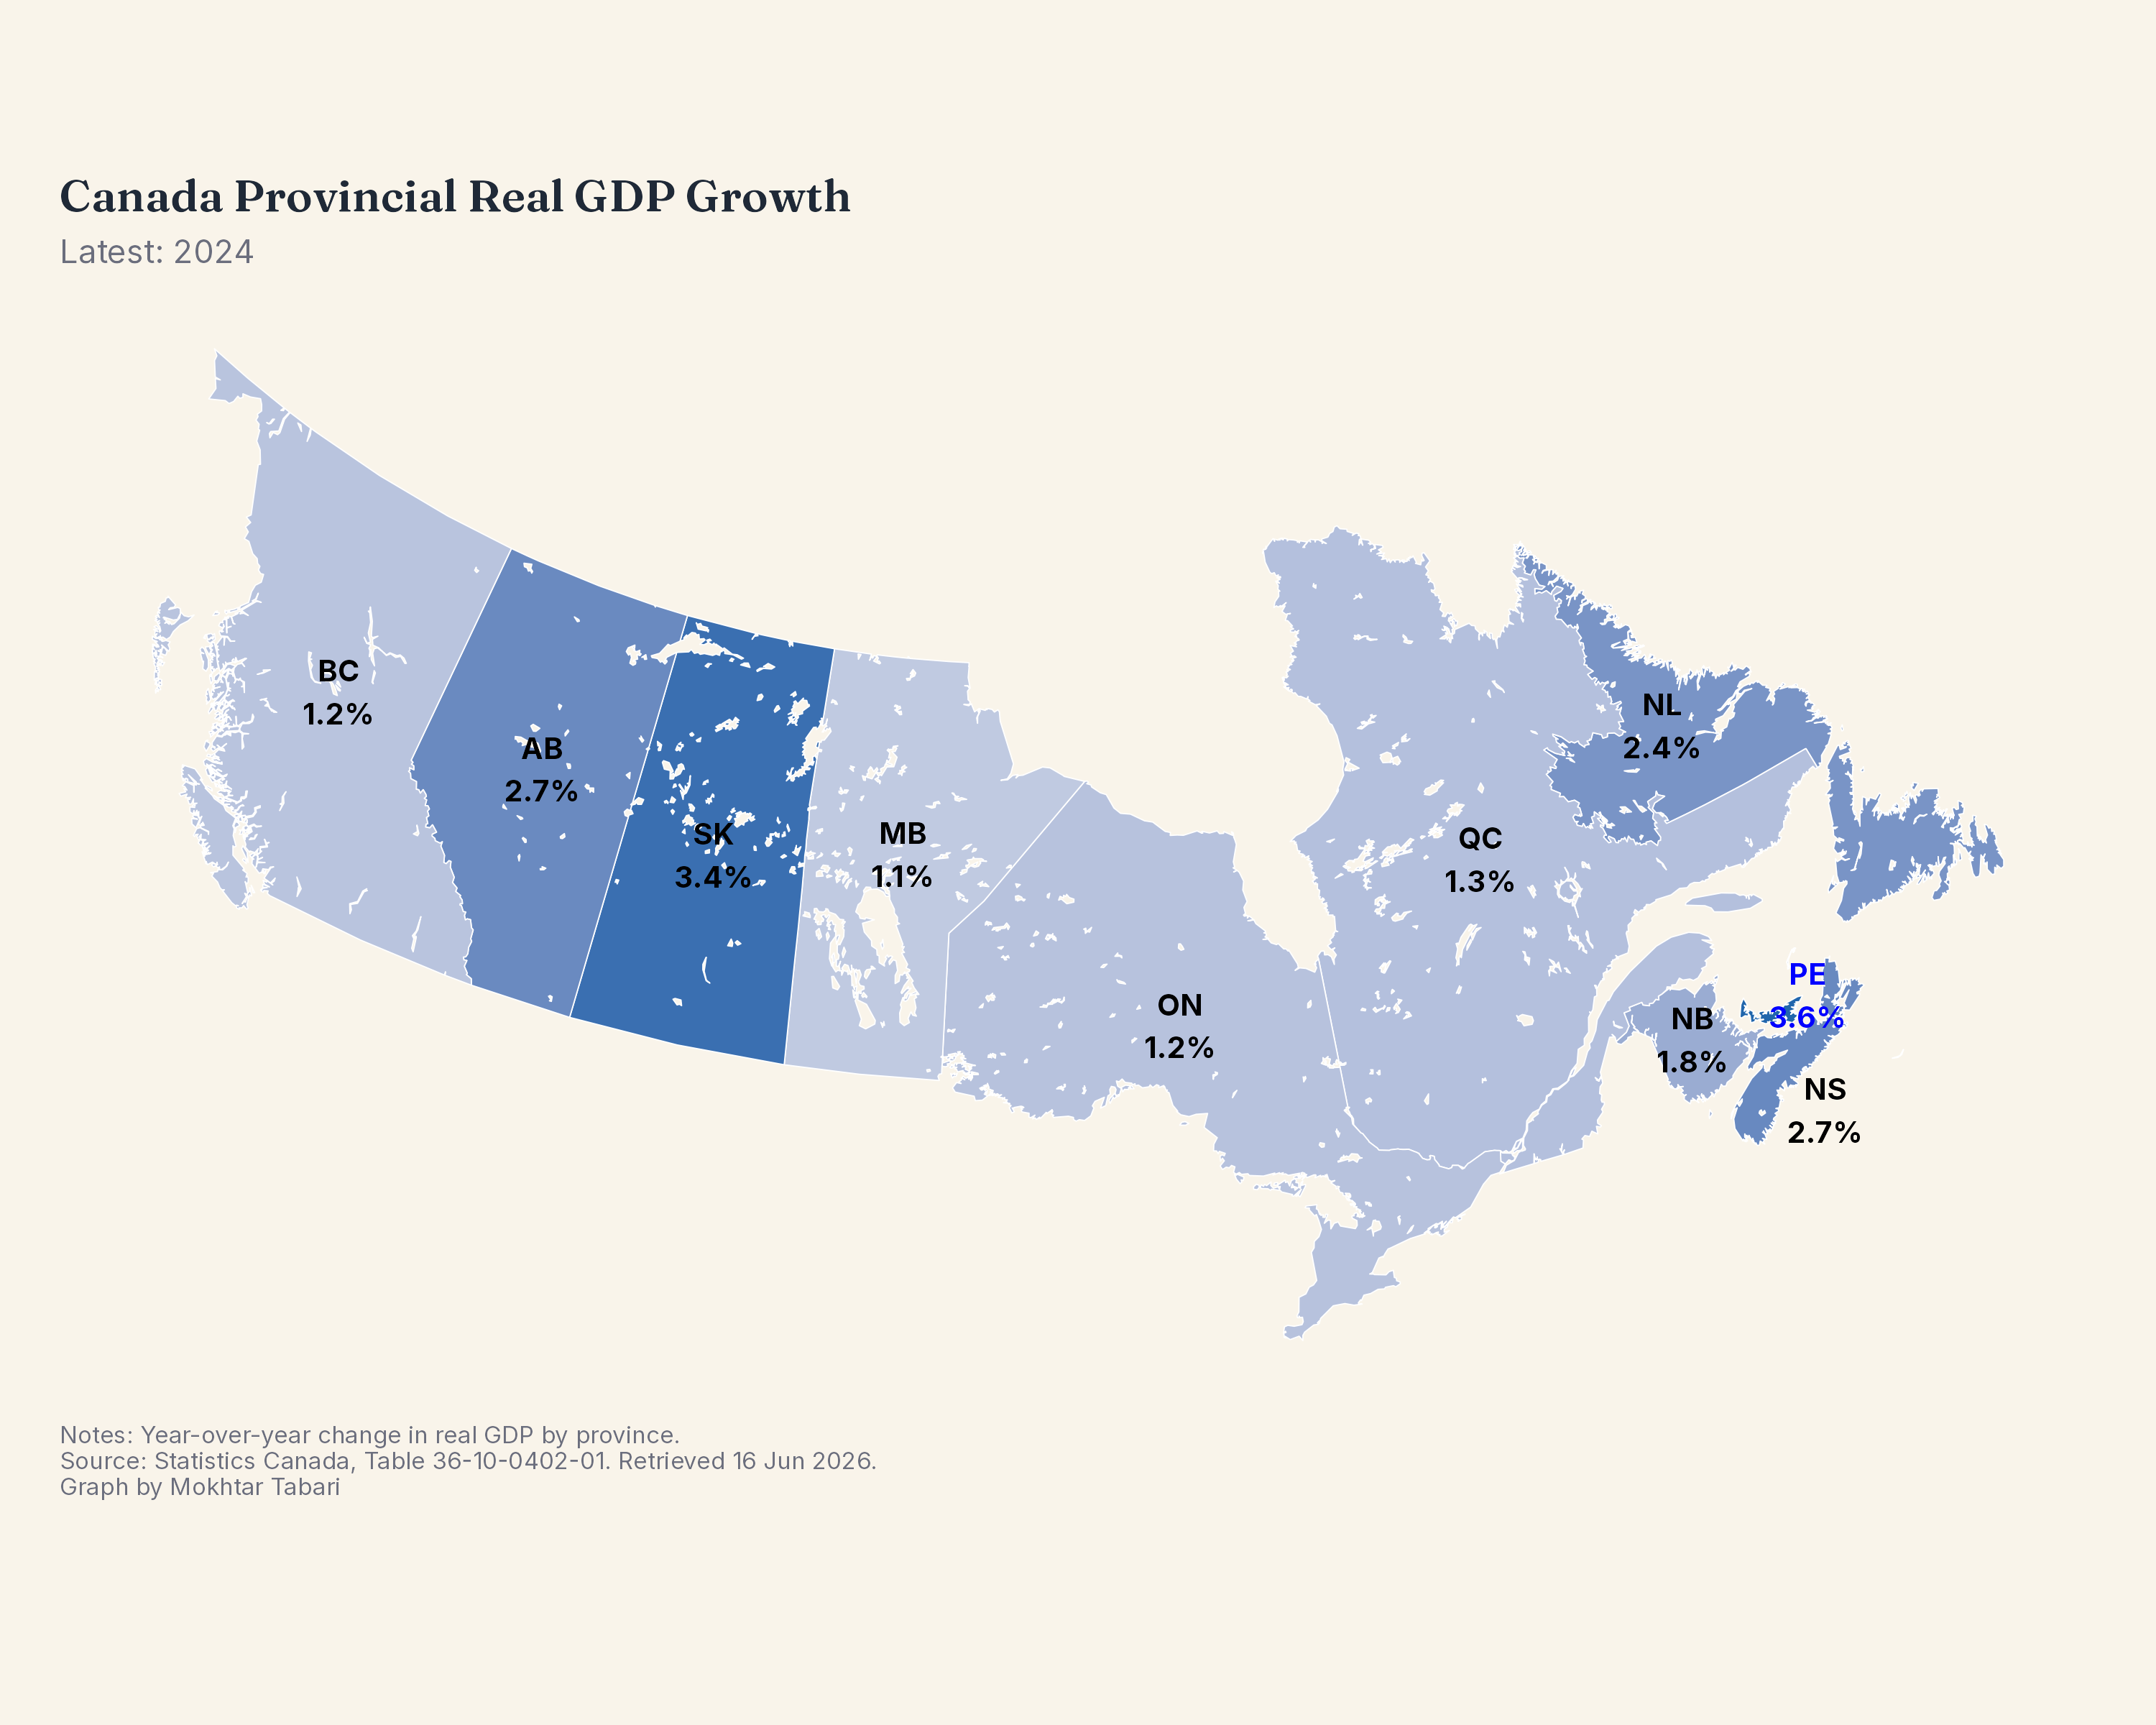
Recent real GDP growth rates mapped across Canadian provinces
Data through Mar 2026
Provincial Sectors
Waterfall breakdown of industry contributions to monthly GDP change
Data through Mar 2026
Sectors Industry-level real GDP growth rates with top performers highlighted
Data through 2024
Sectors Month-over-month industry growth rates with top performers highlighted
Data through Mar 2026
Sectors Real GDP growth rates by major industry
Data through 2024
Sectors 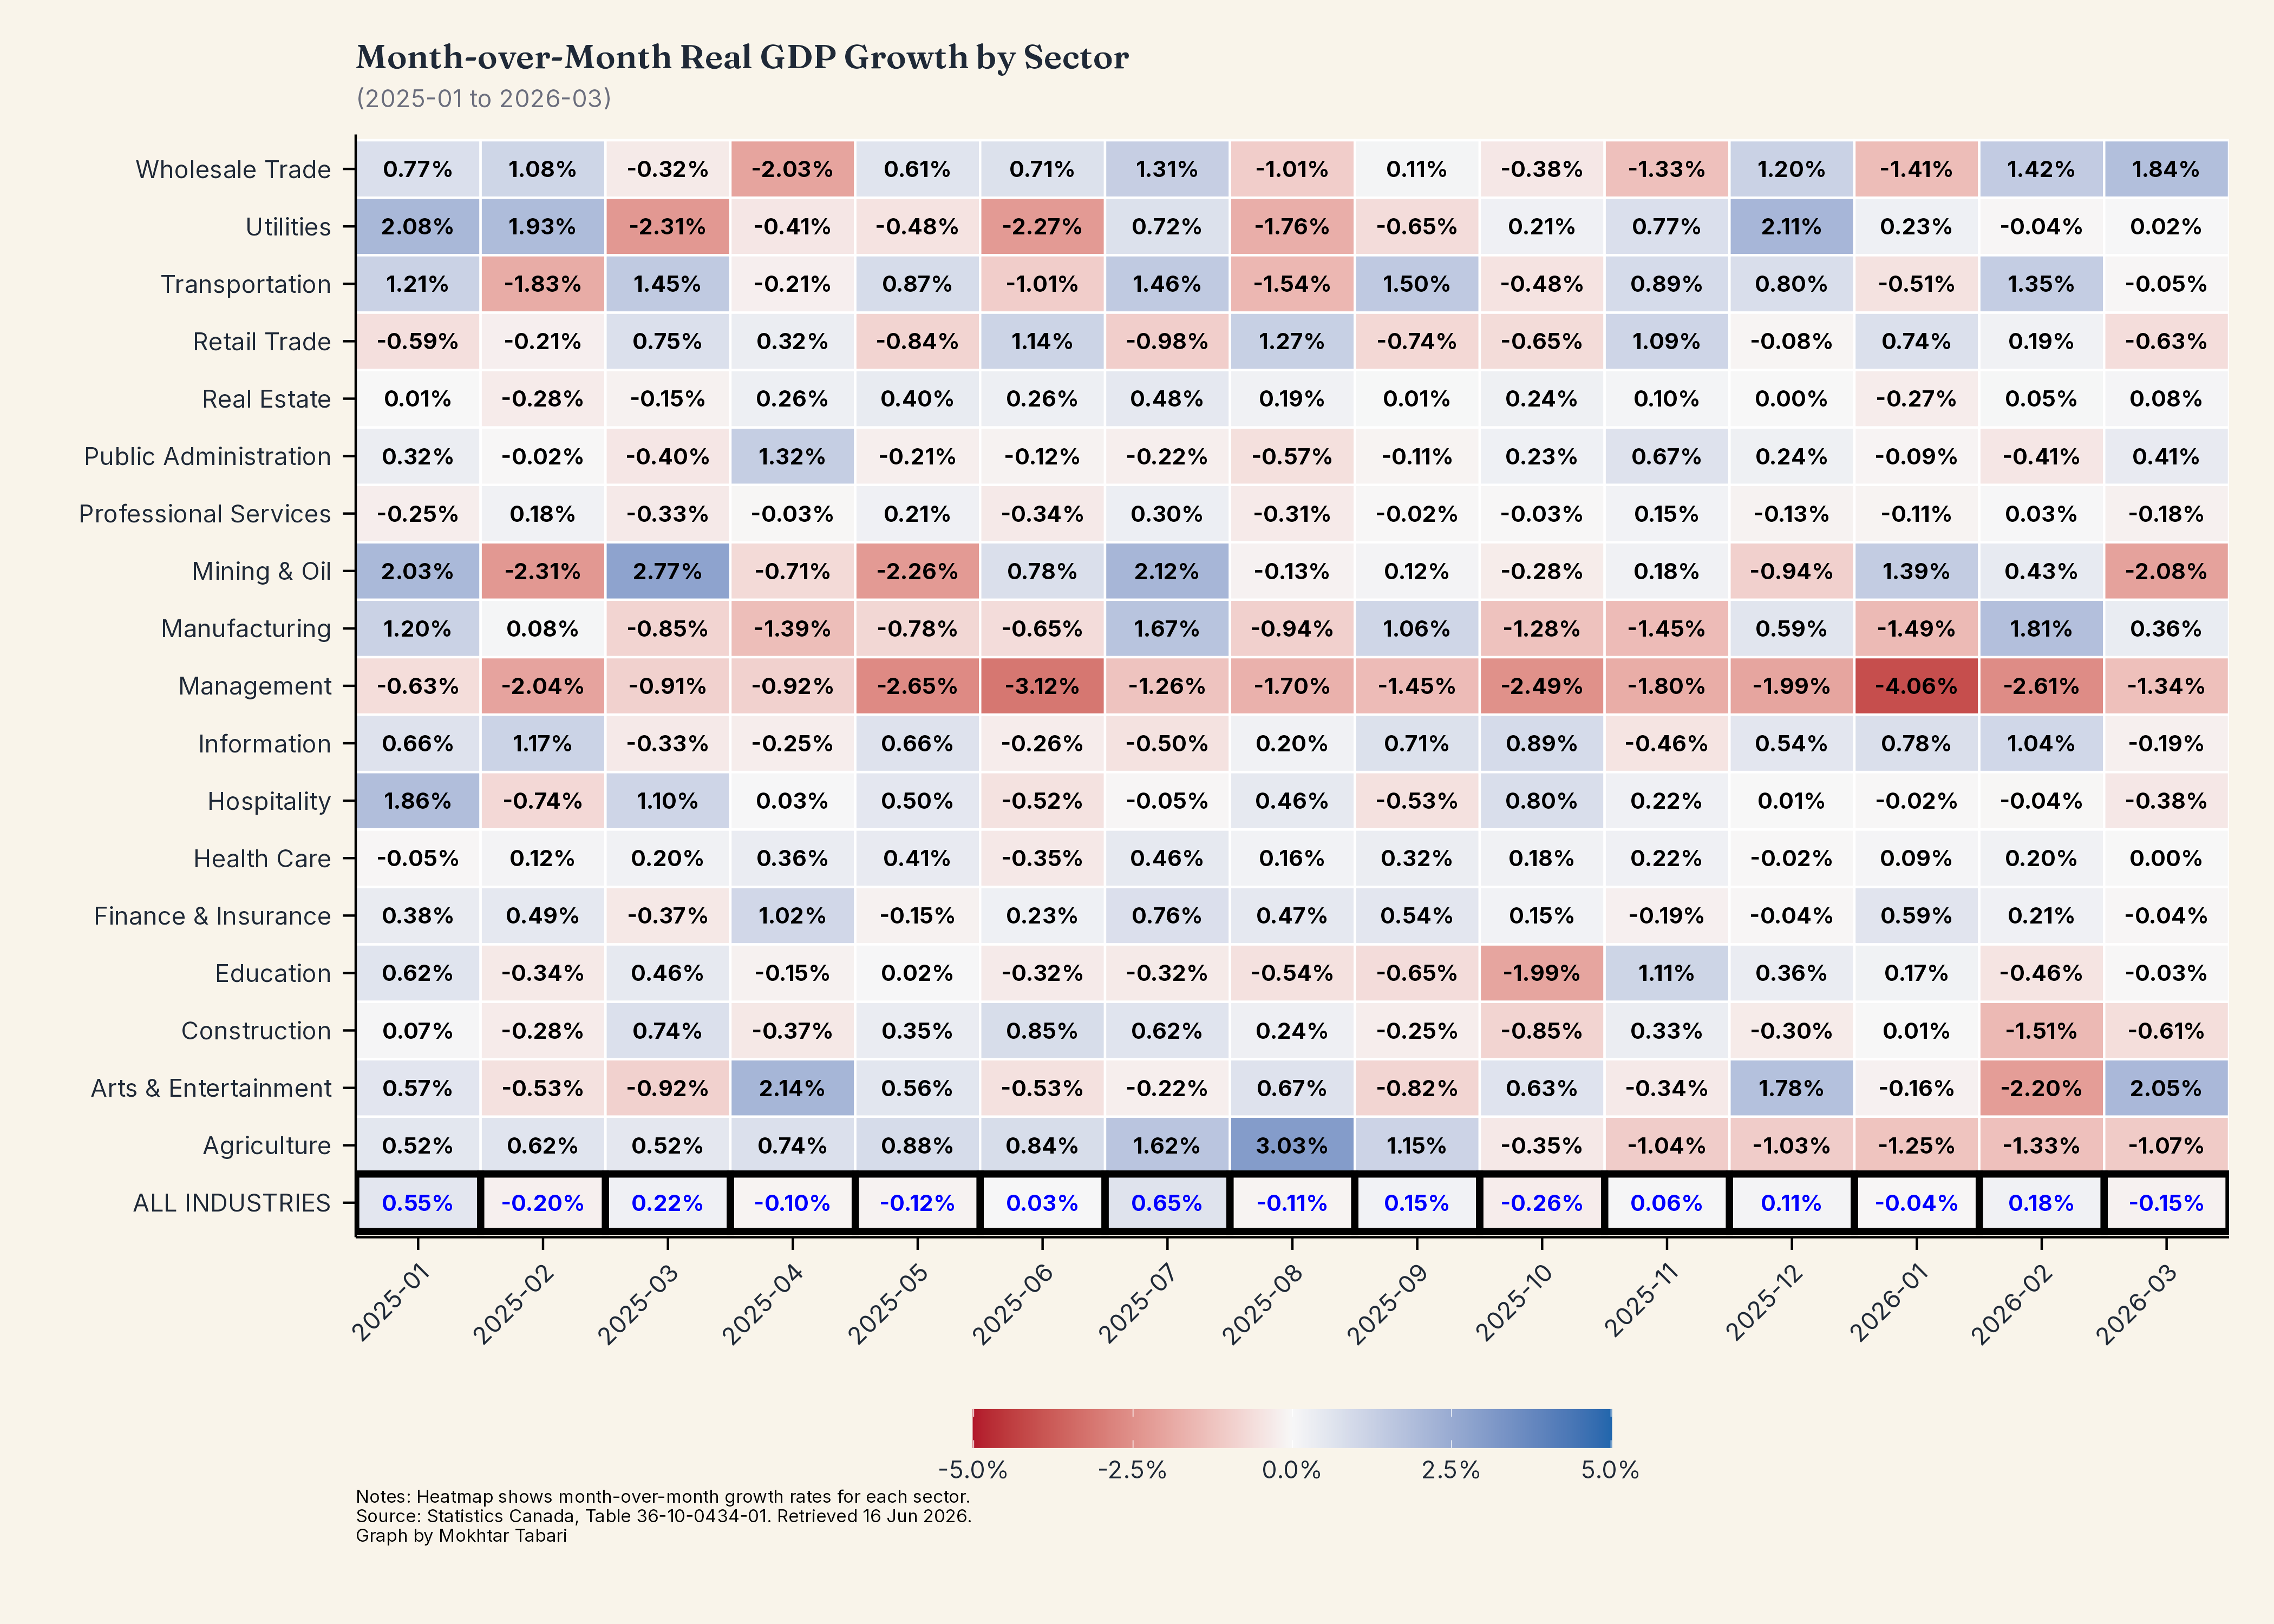
Month-by-month GDP growth across industries, colour-coded
Data through Mar 2026
Sectors Tile-style treemap of industry shares in Canadian real GDP
Data through Mar 2026
Sectors Relative size of each industry in the Canadian economy
Data through Mar 2026
Sectors Ranked bar chart of real GDP by industry
Data through Mar 2026
Sectors Latest monthly GDP change ranked by industry
Data through Mar 2026
Sectors