Charts
Canadian economy in charts
Publication-quality visualizations built from official sources including Statistics Canada and FRED — automatically refreshed whenever new data is released.
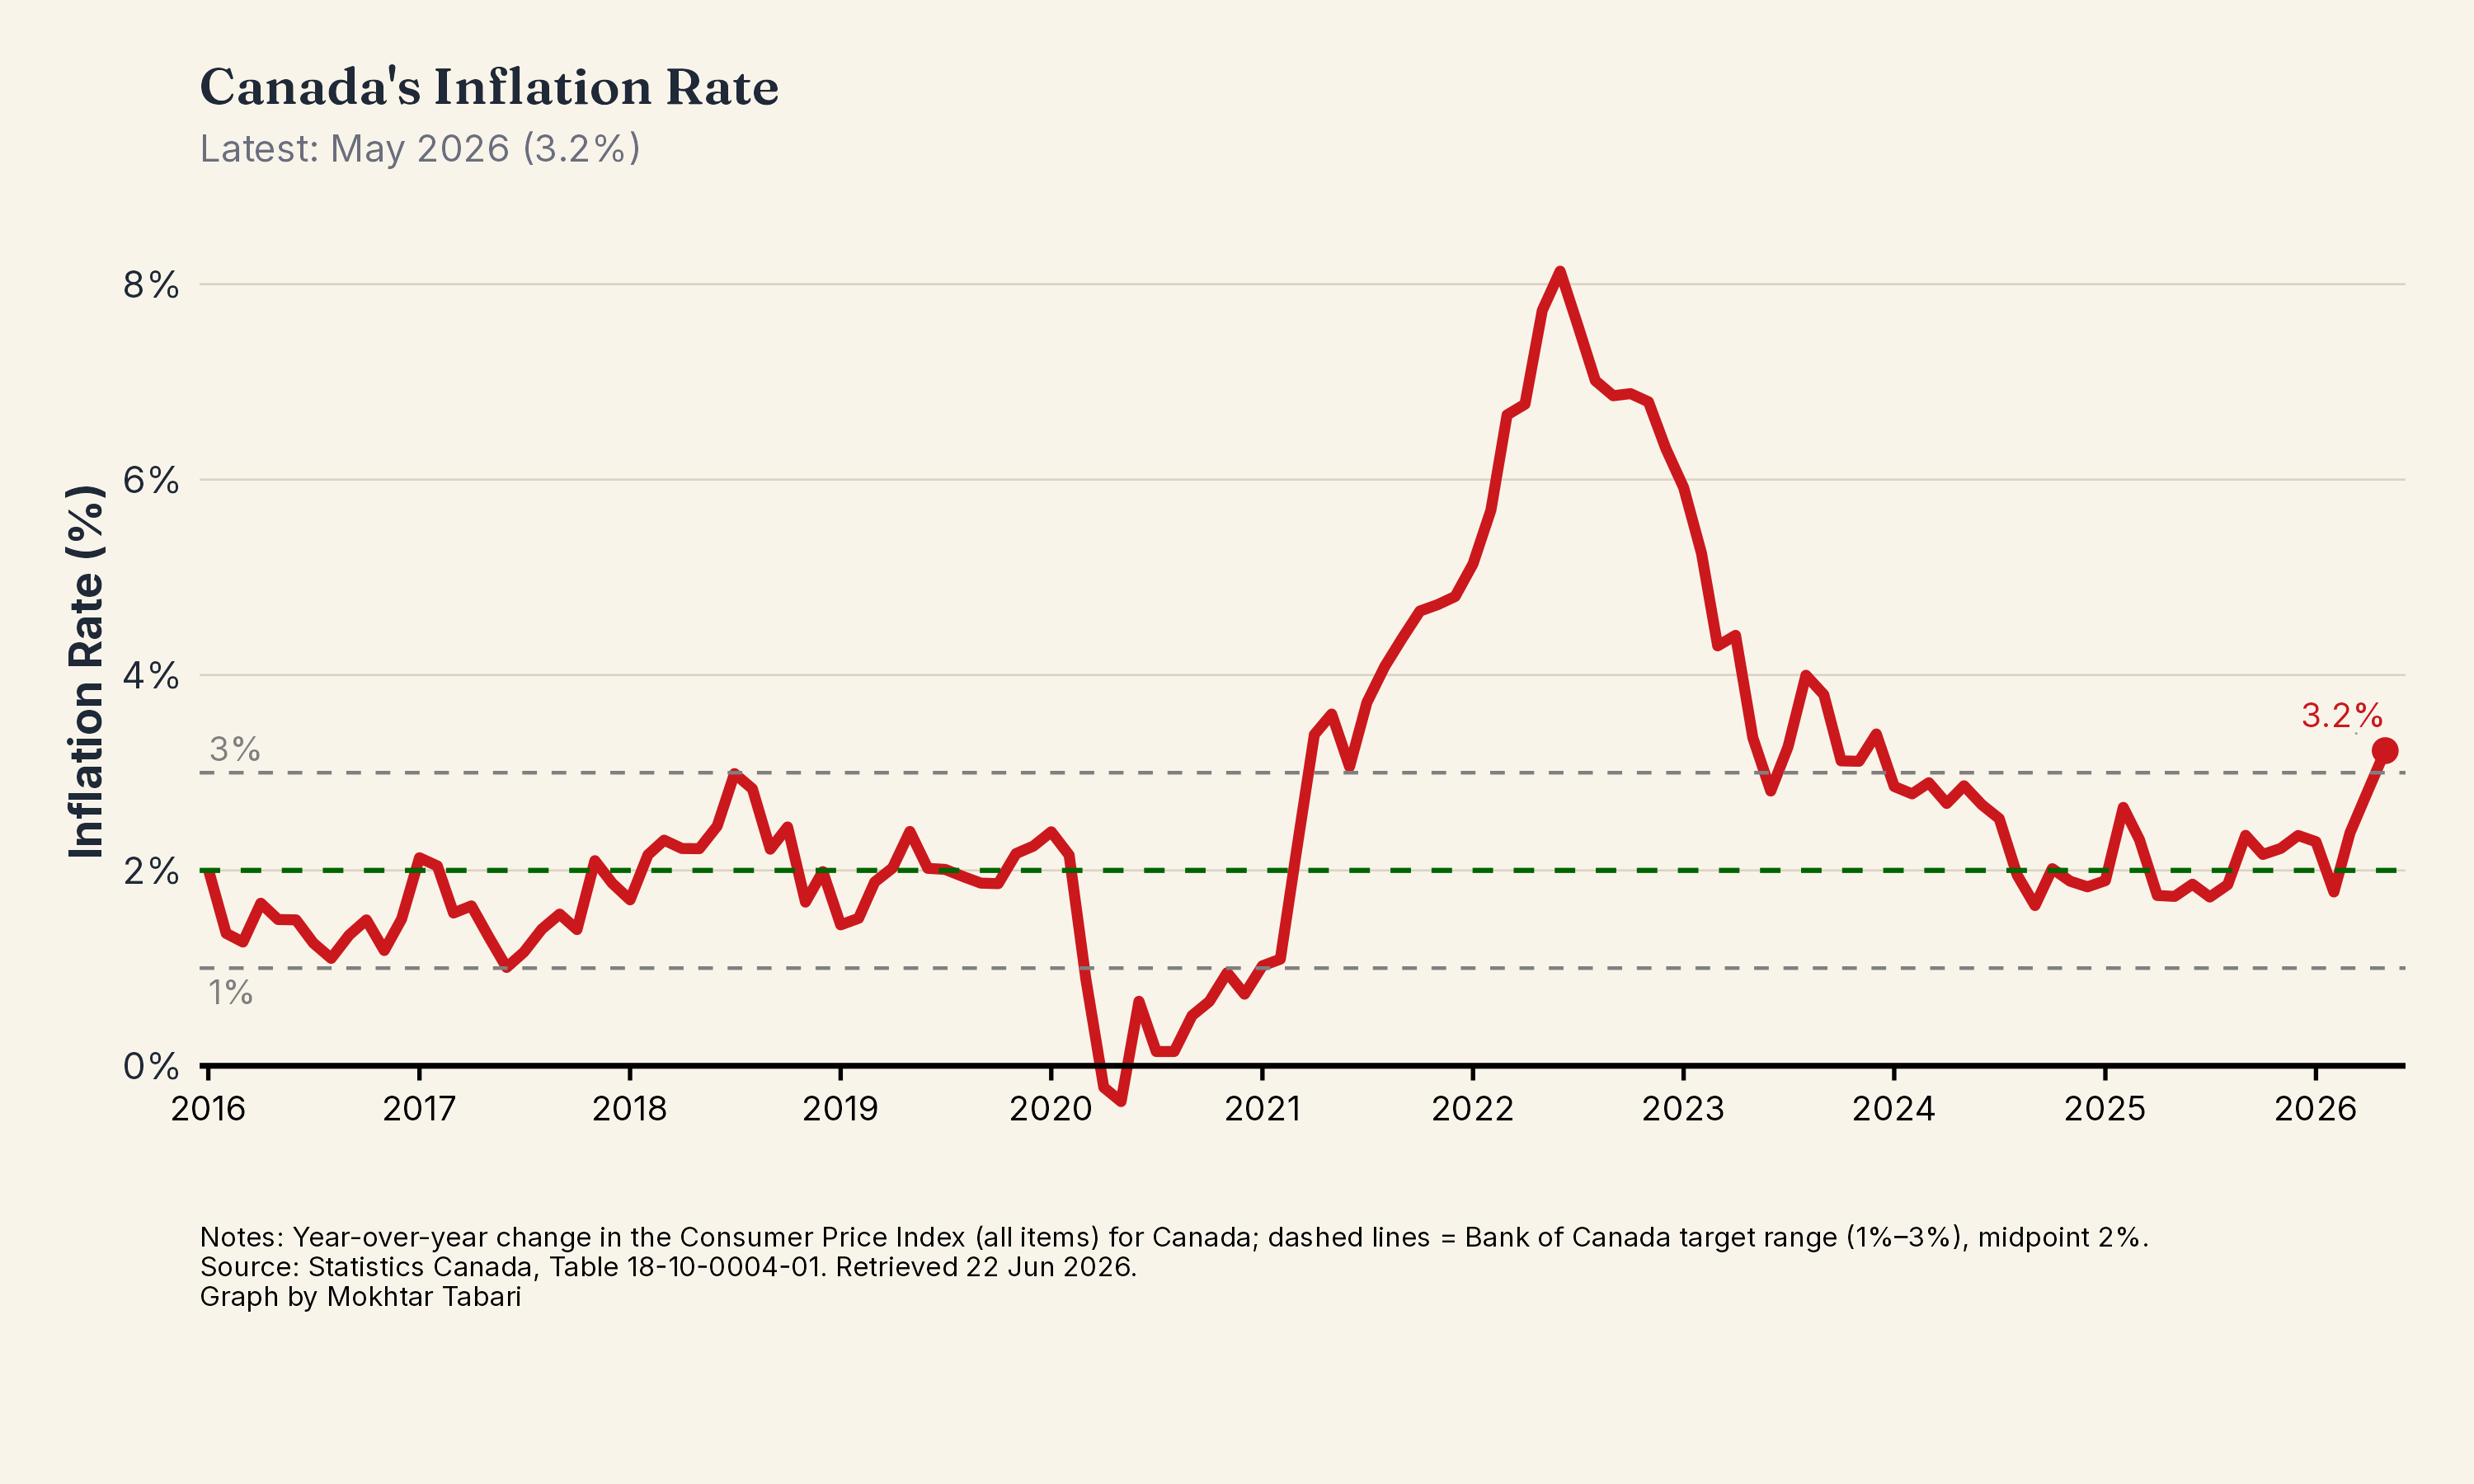
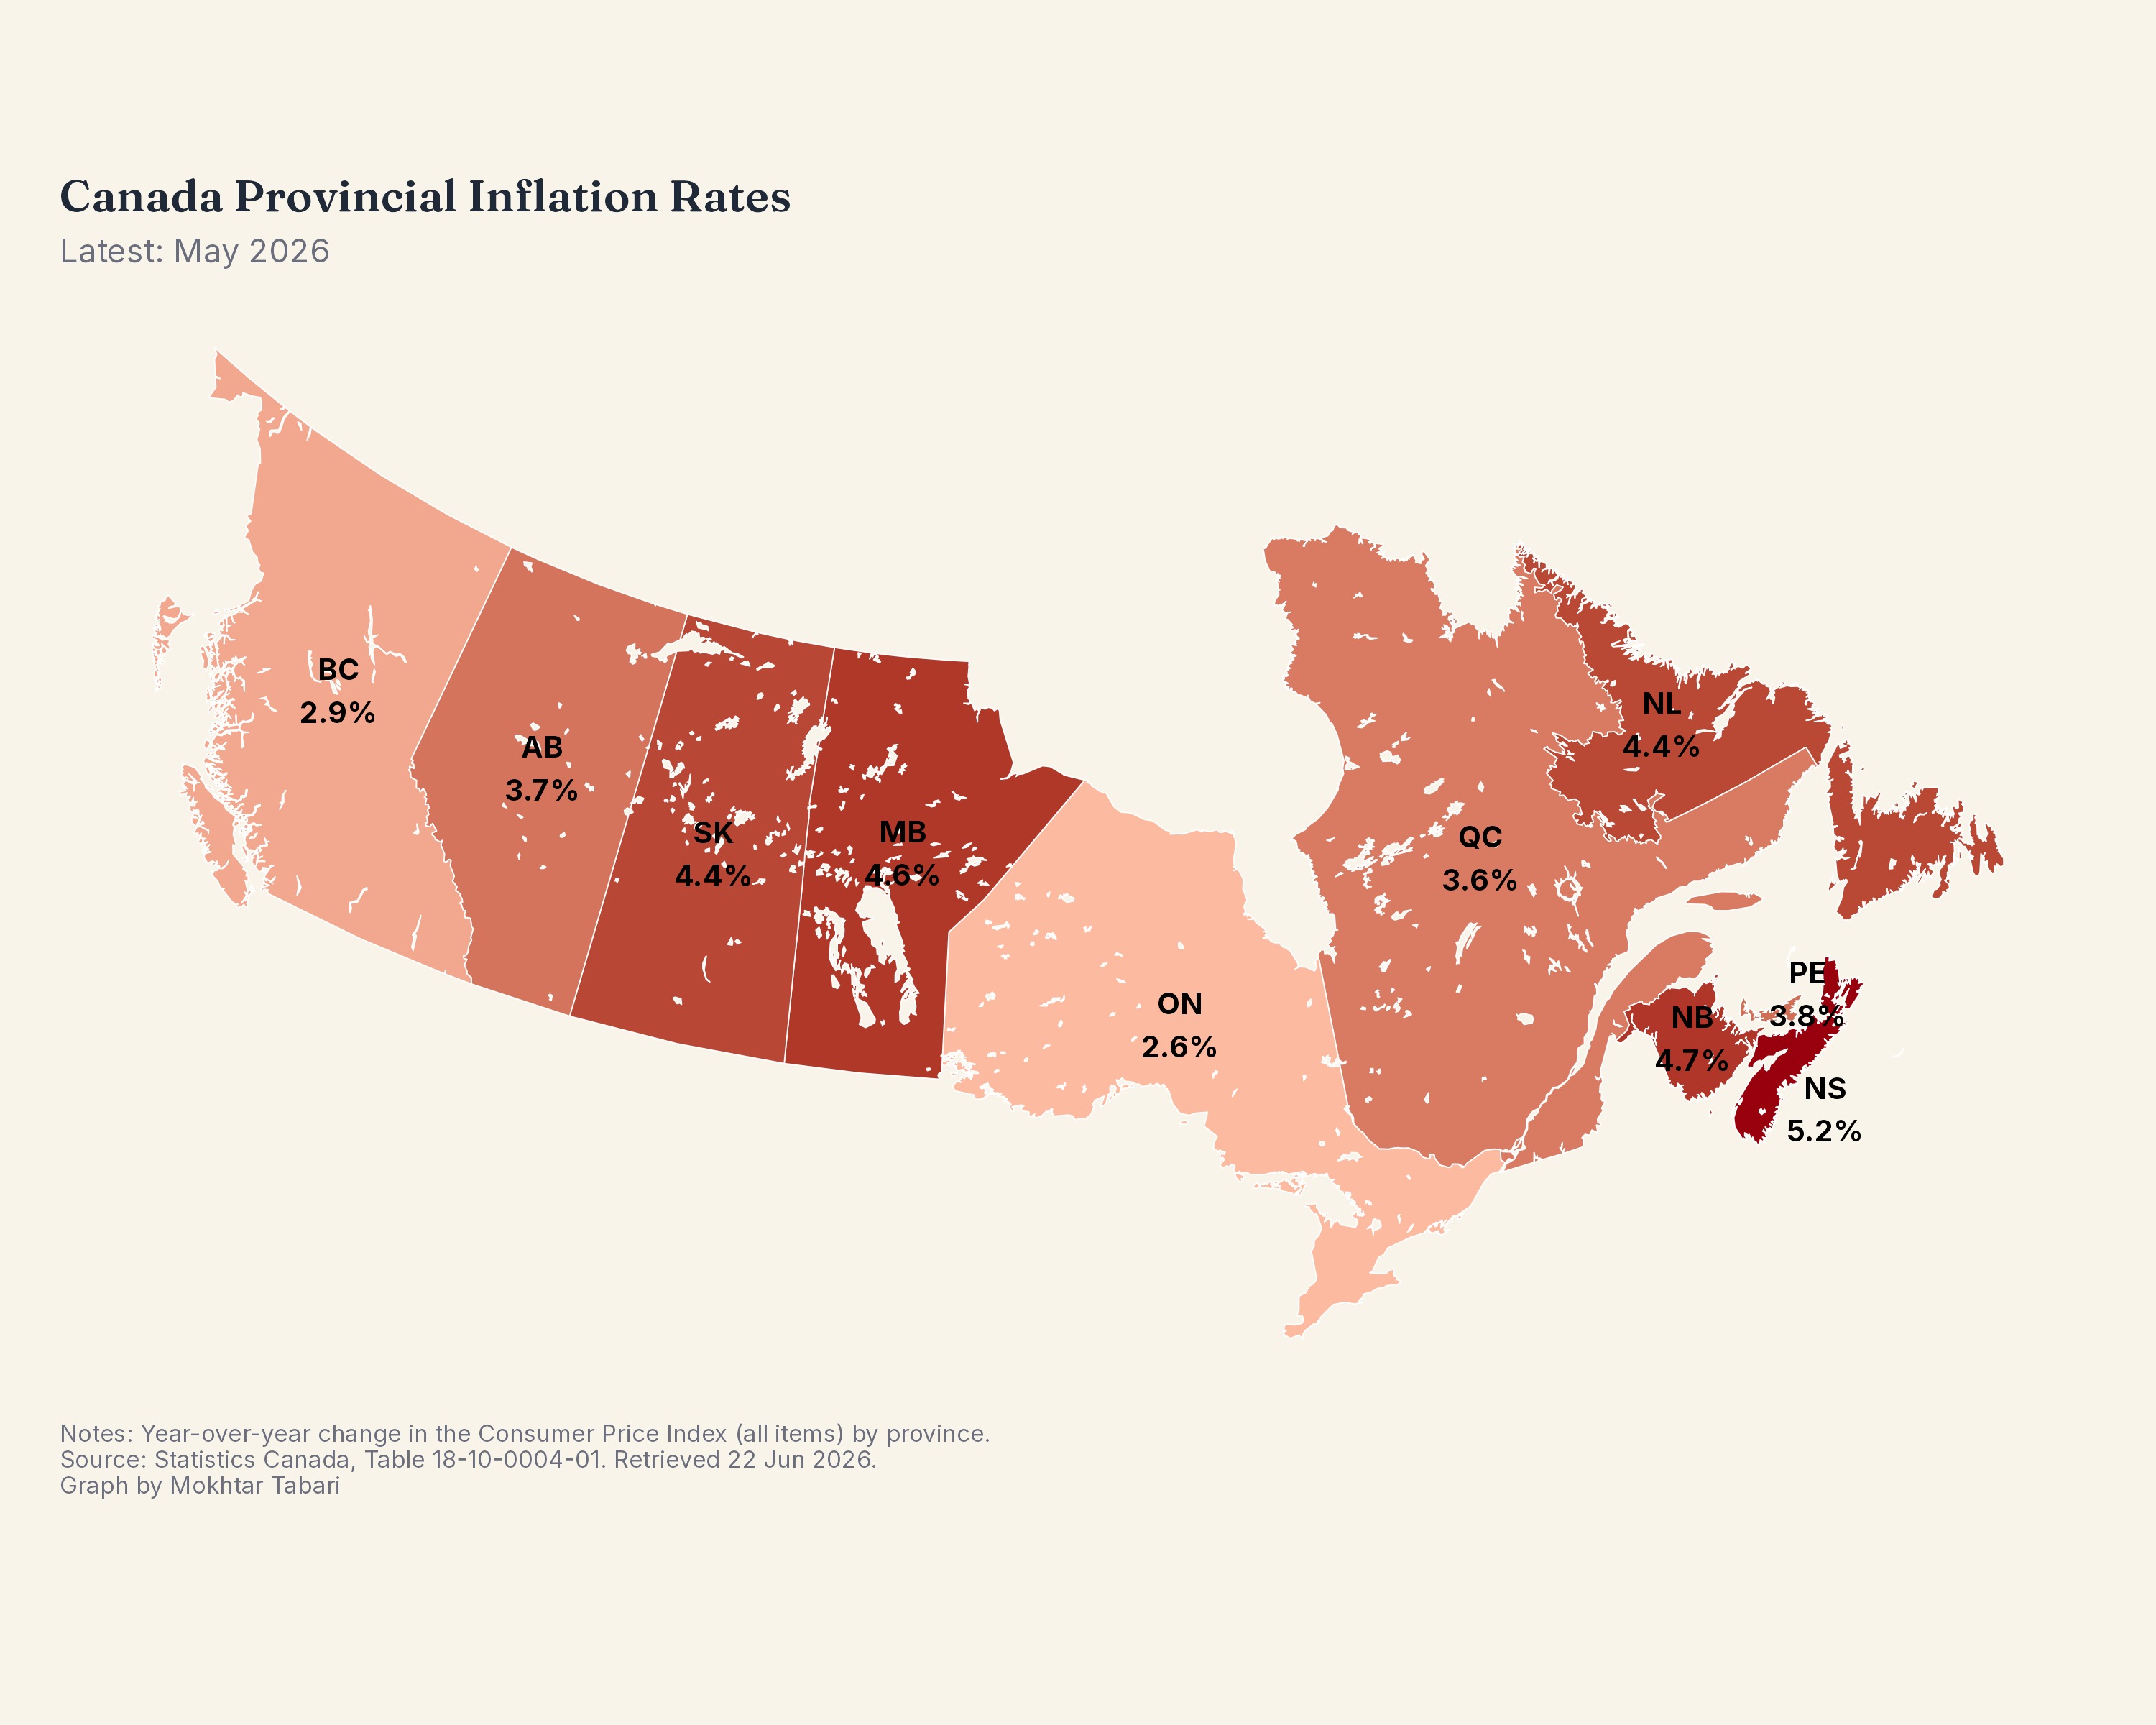
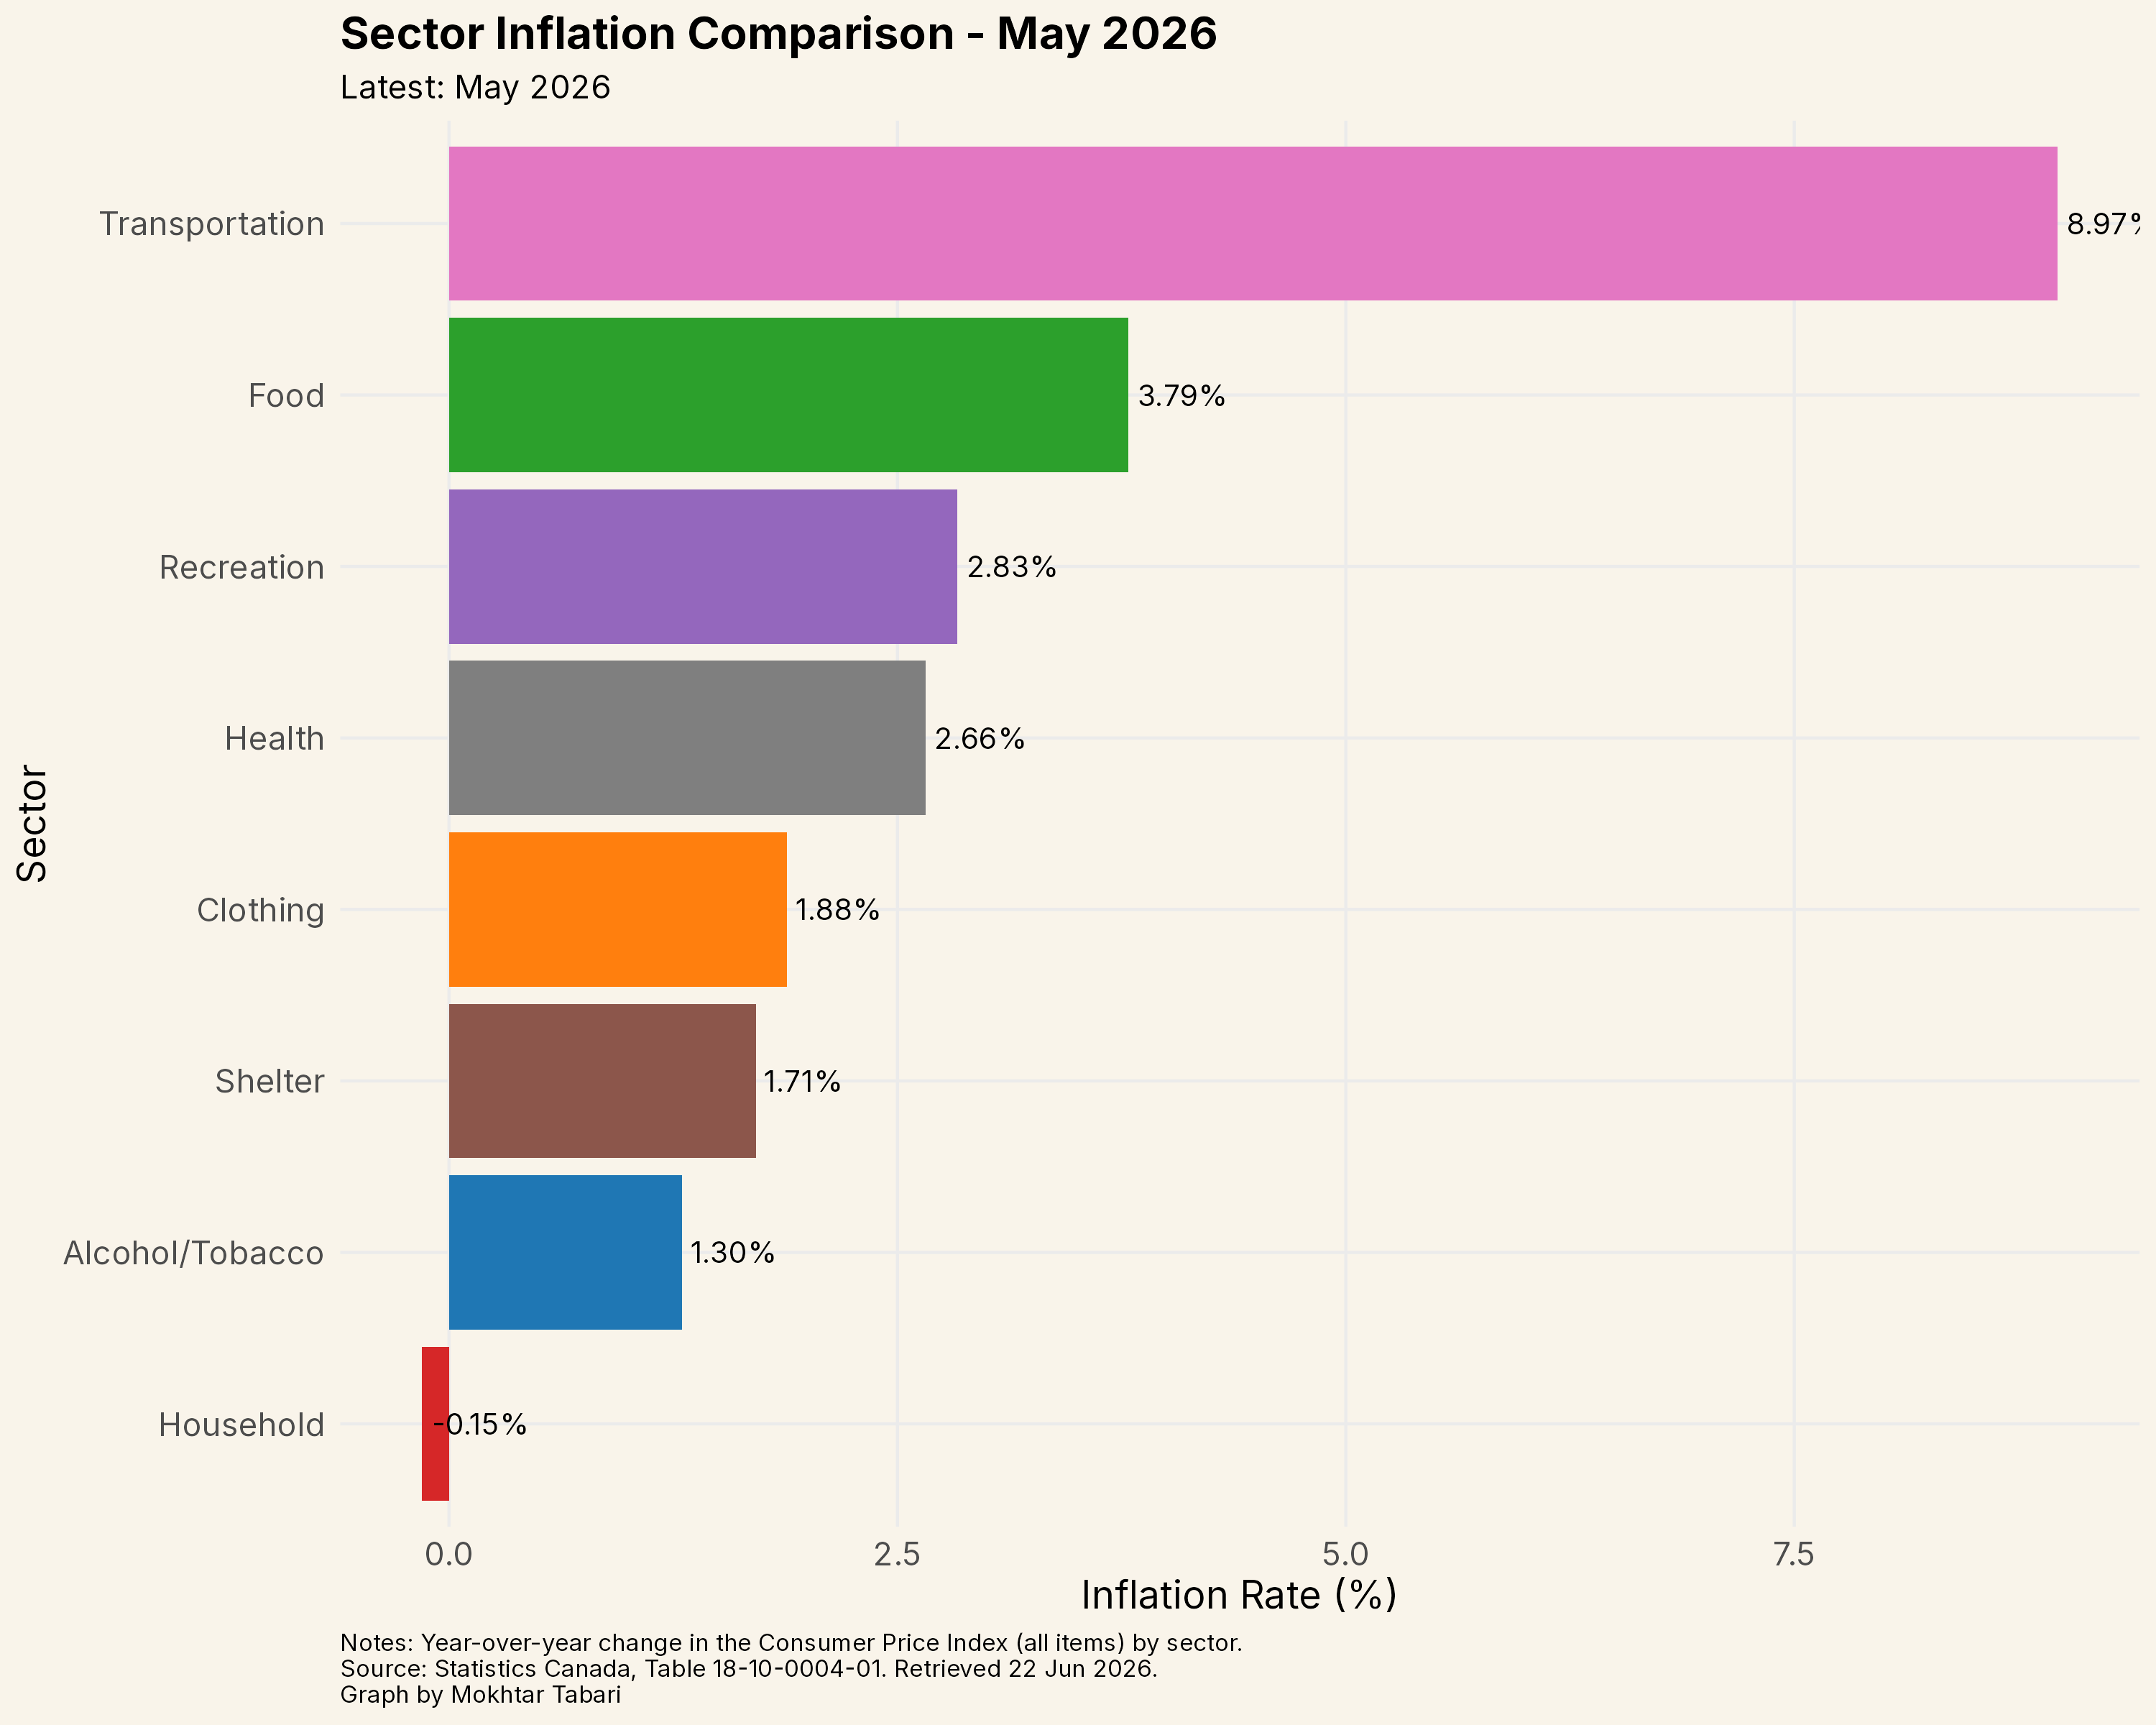
Inflation & Prices
7 chartsCanadian CPI trends, provincial comparisons, and sector-level price dynamics.
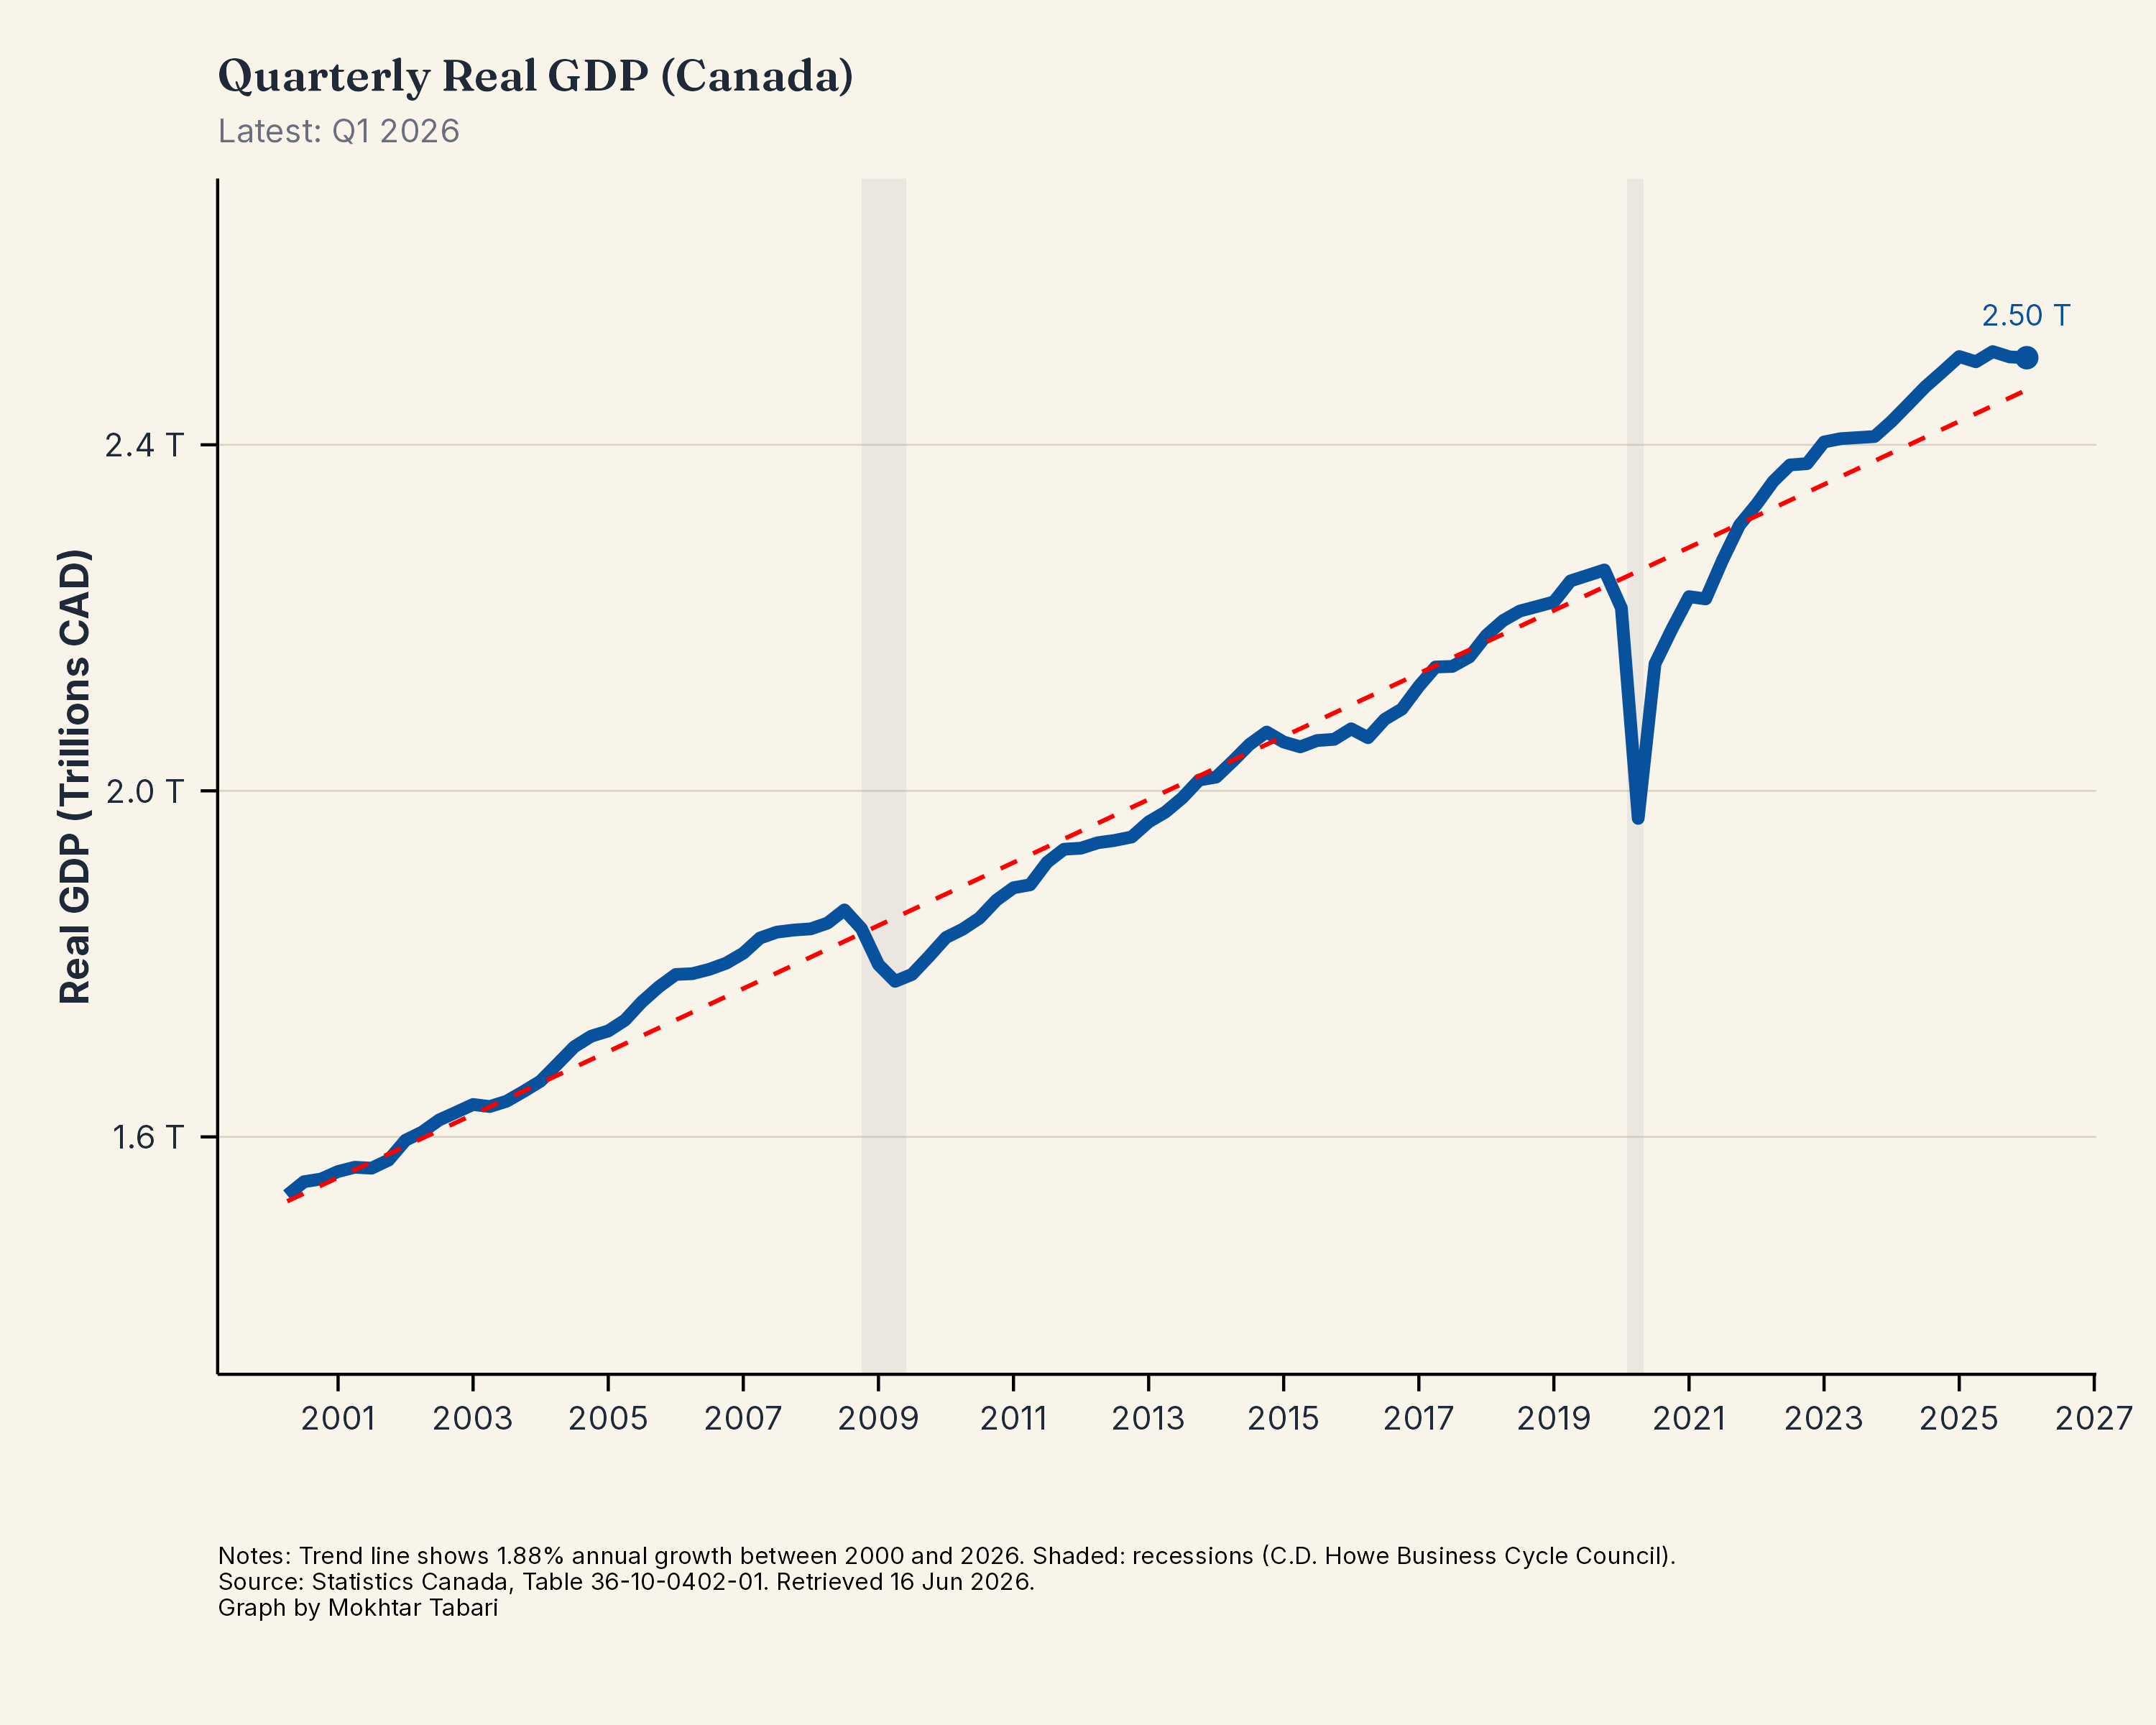
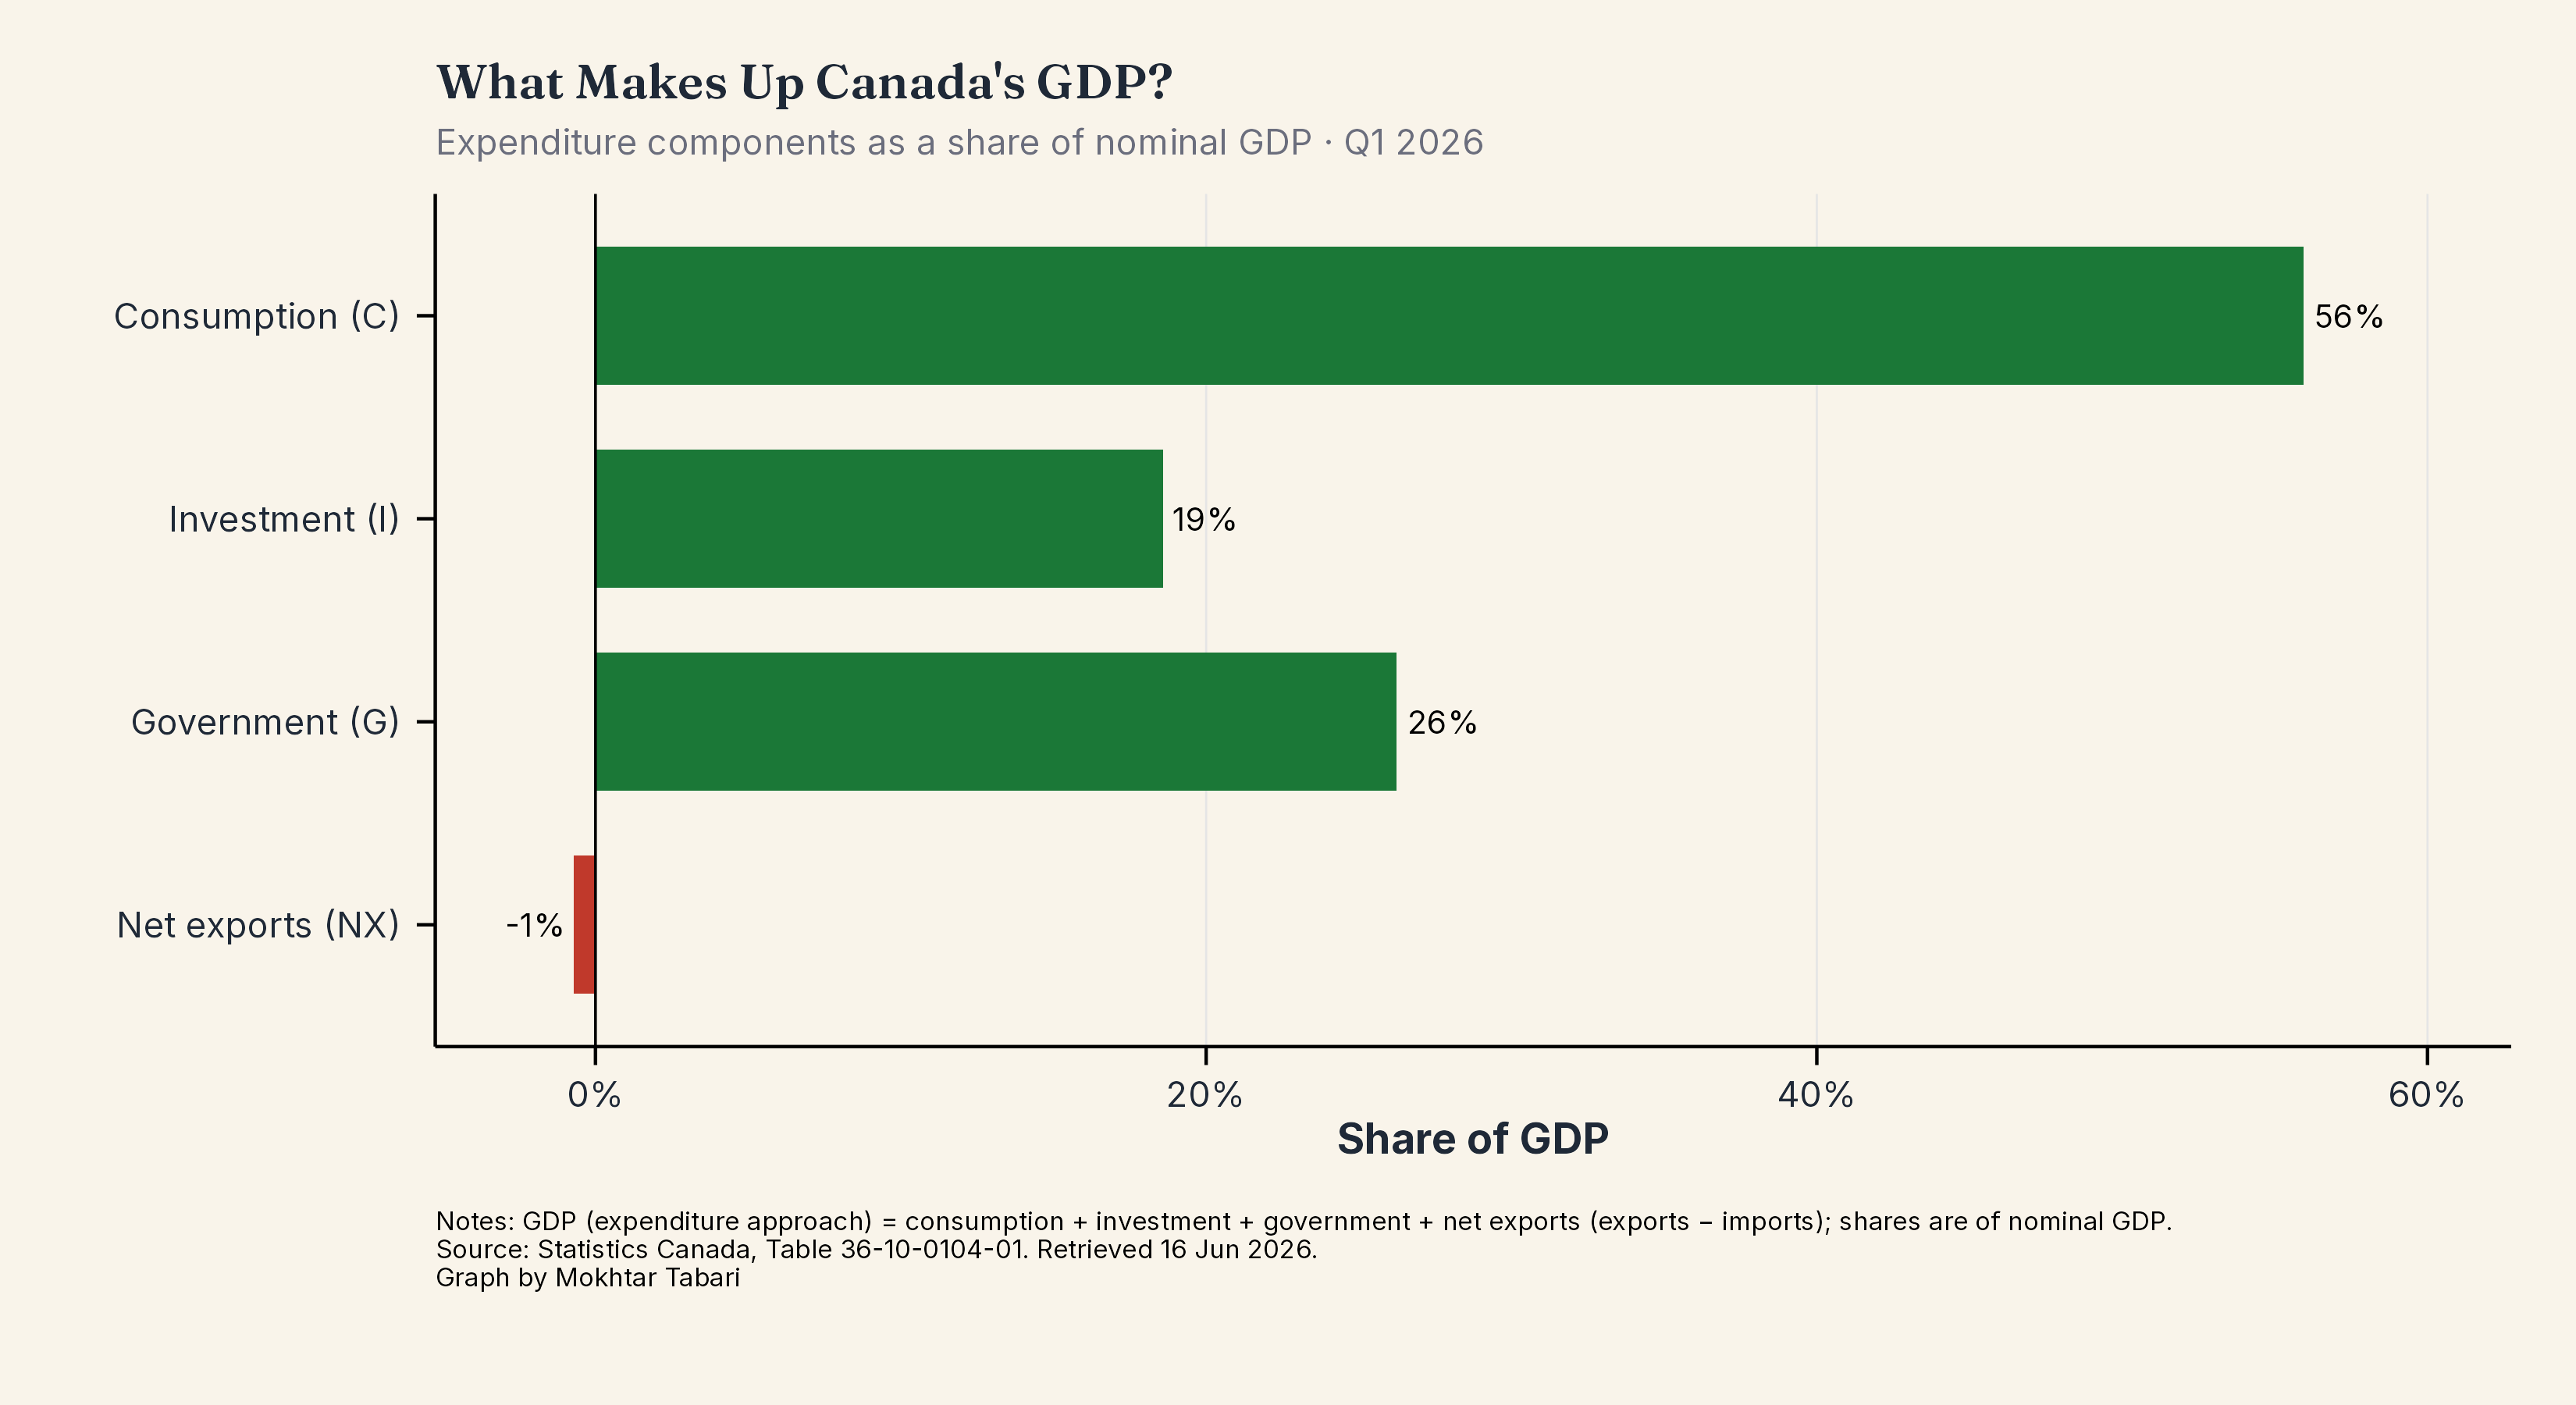
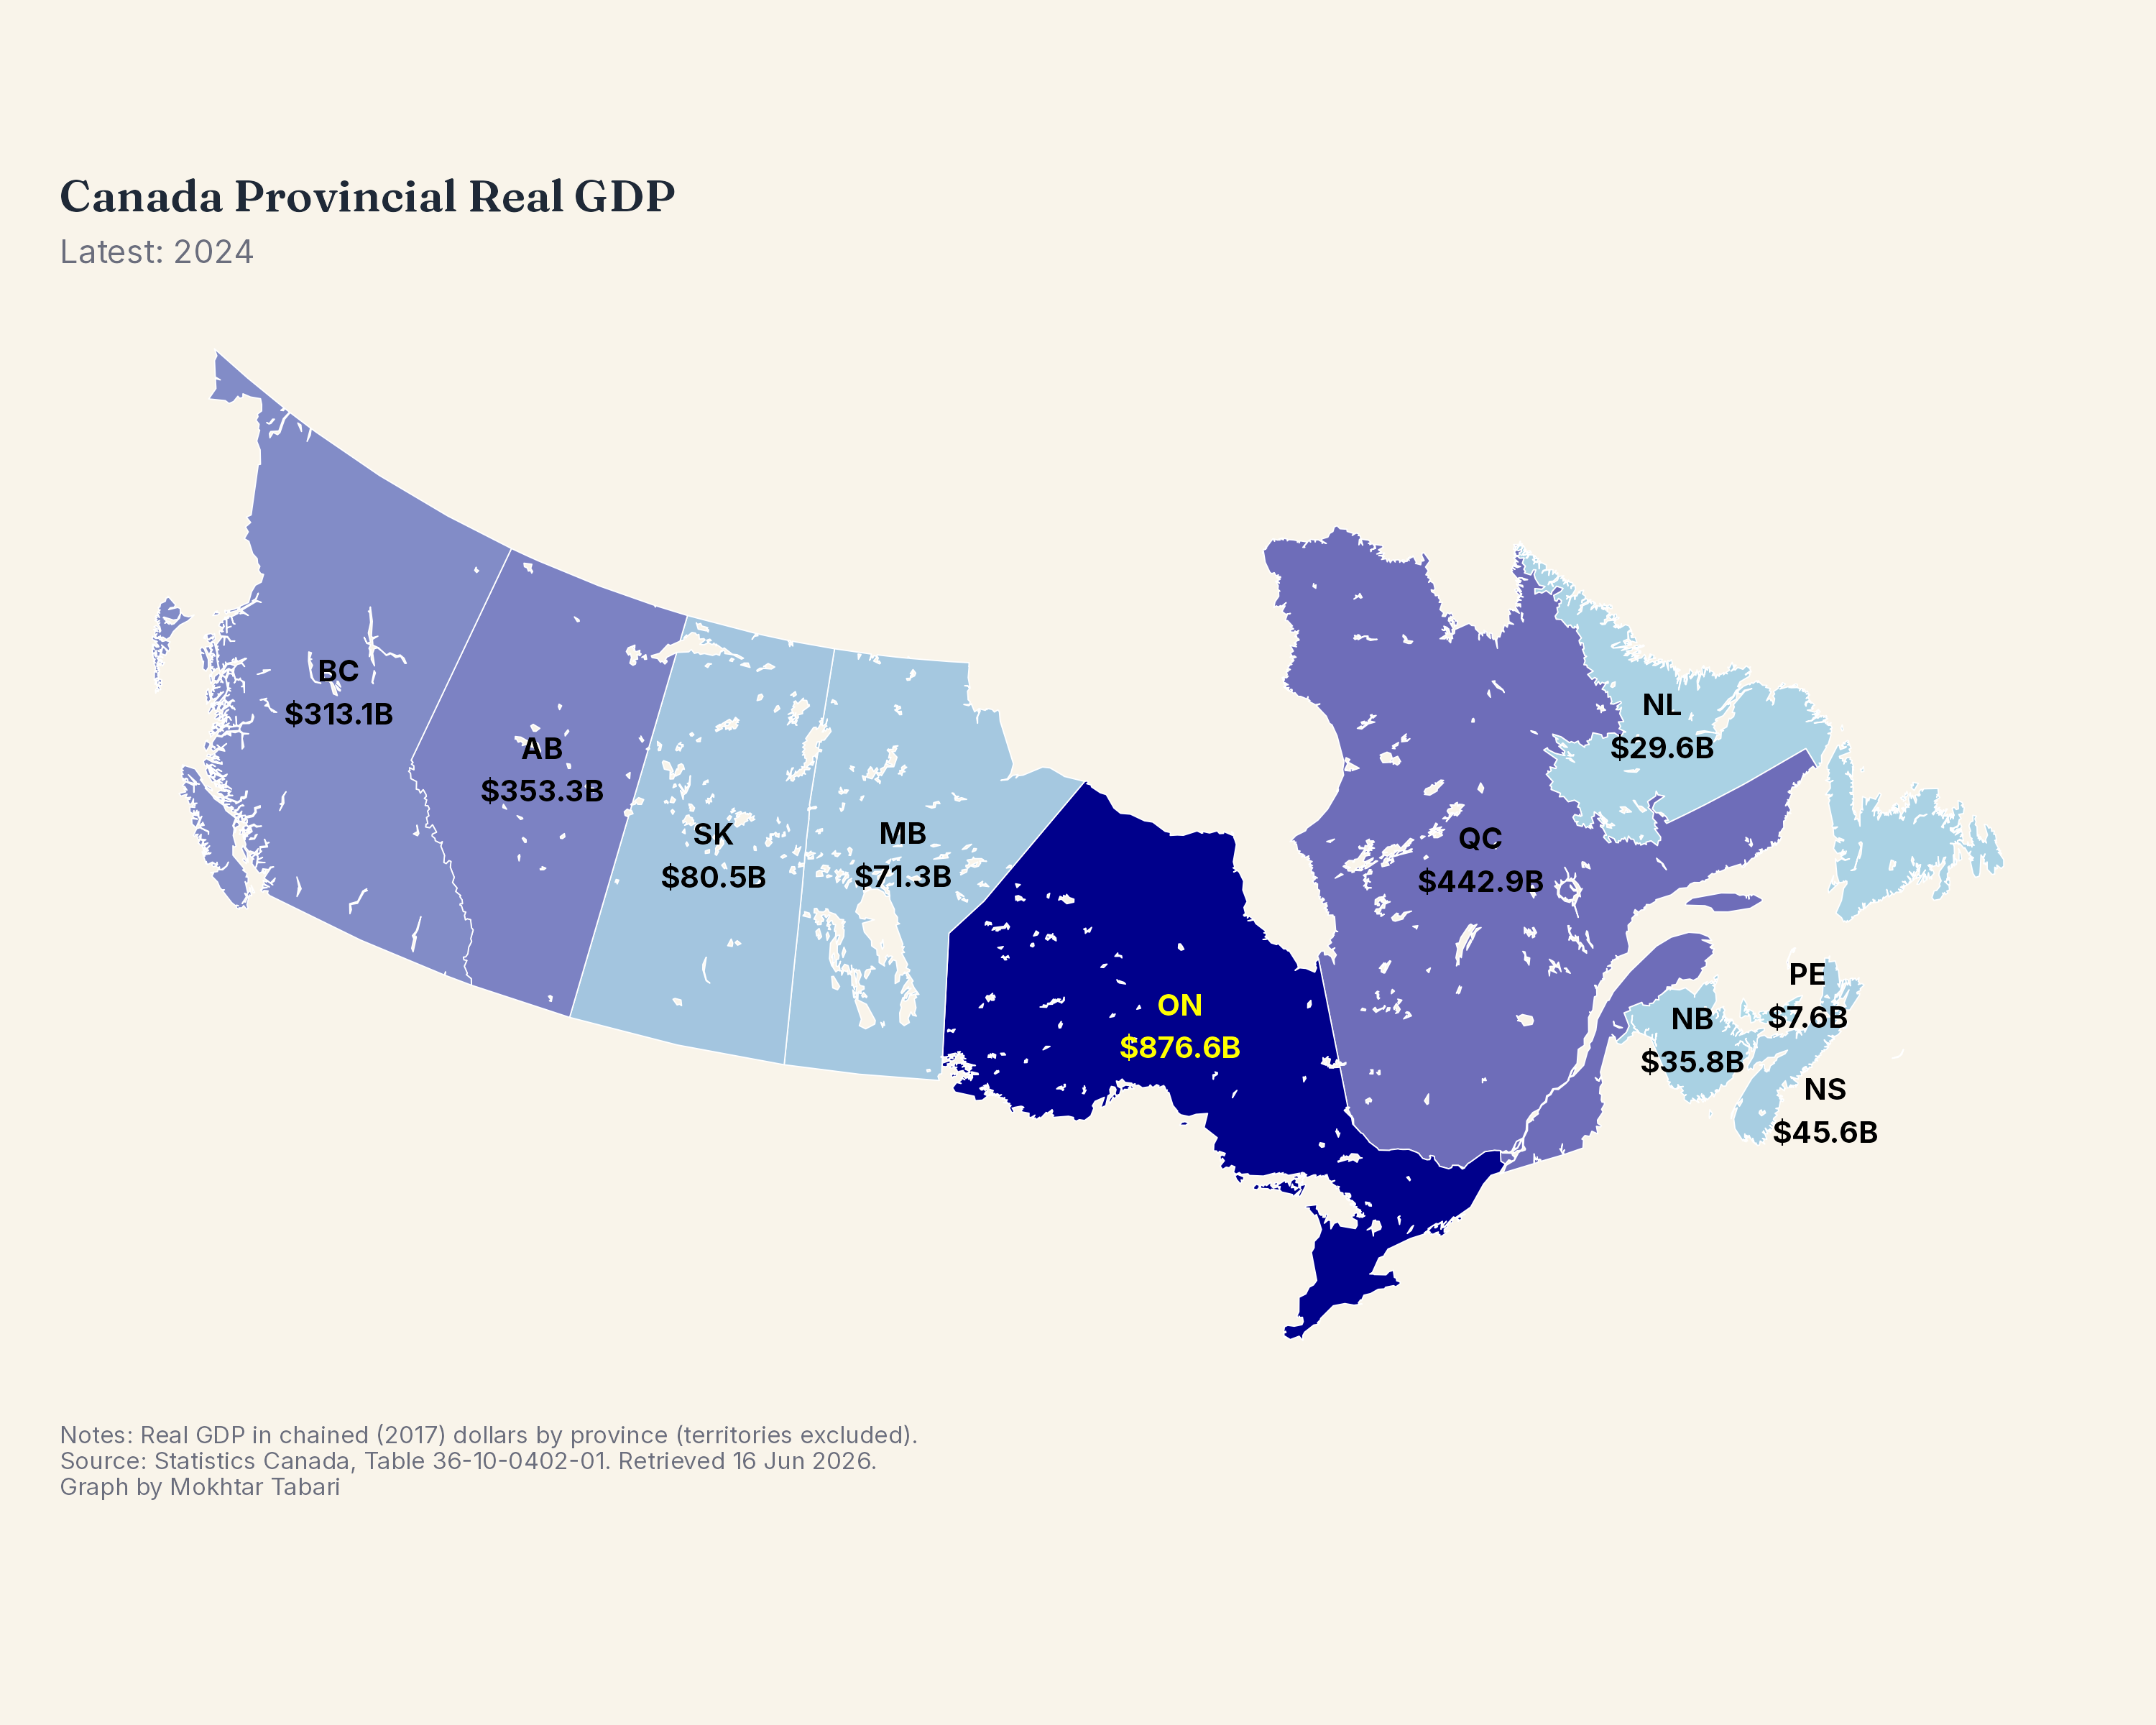
GDP & Economic Growth
16 chartsReal GDP, provincial output, sector contributions, and growth decompositions.
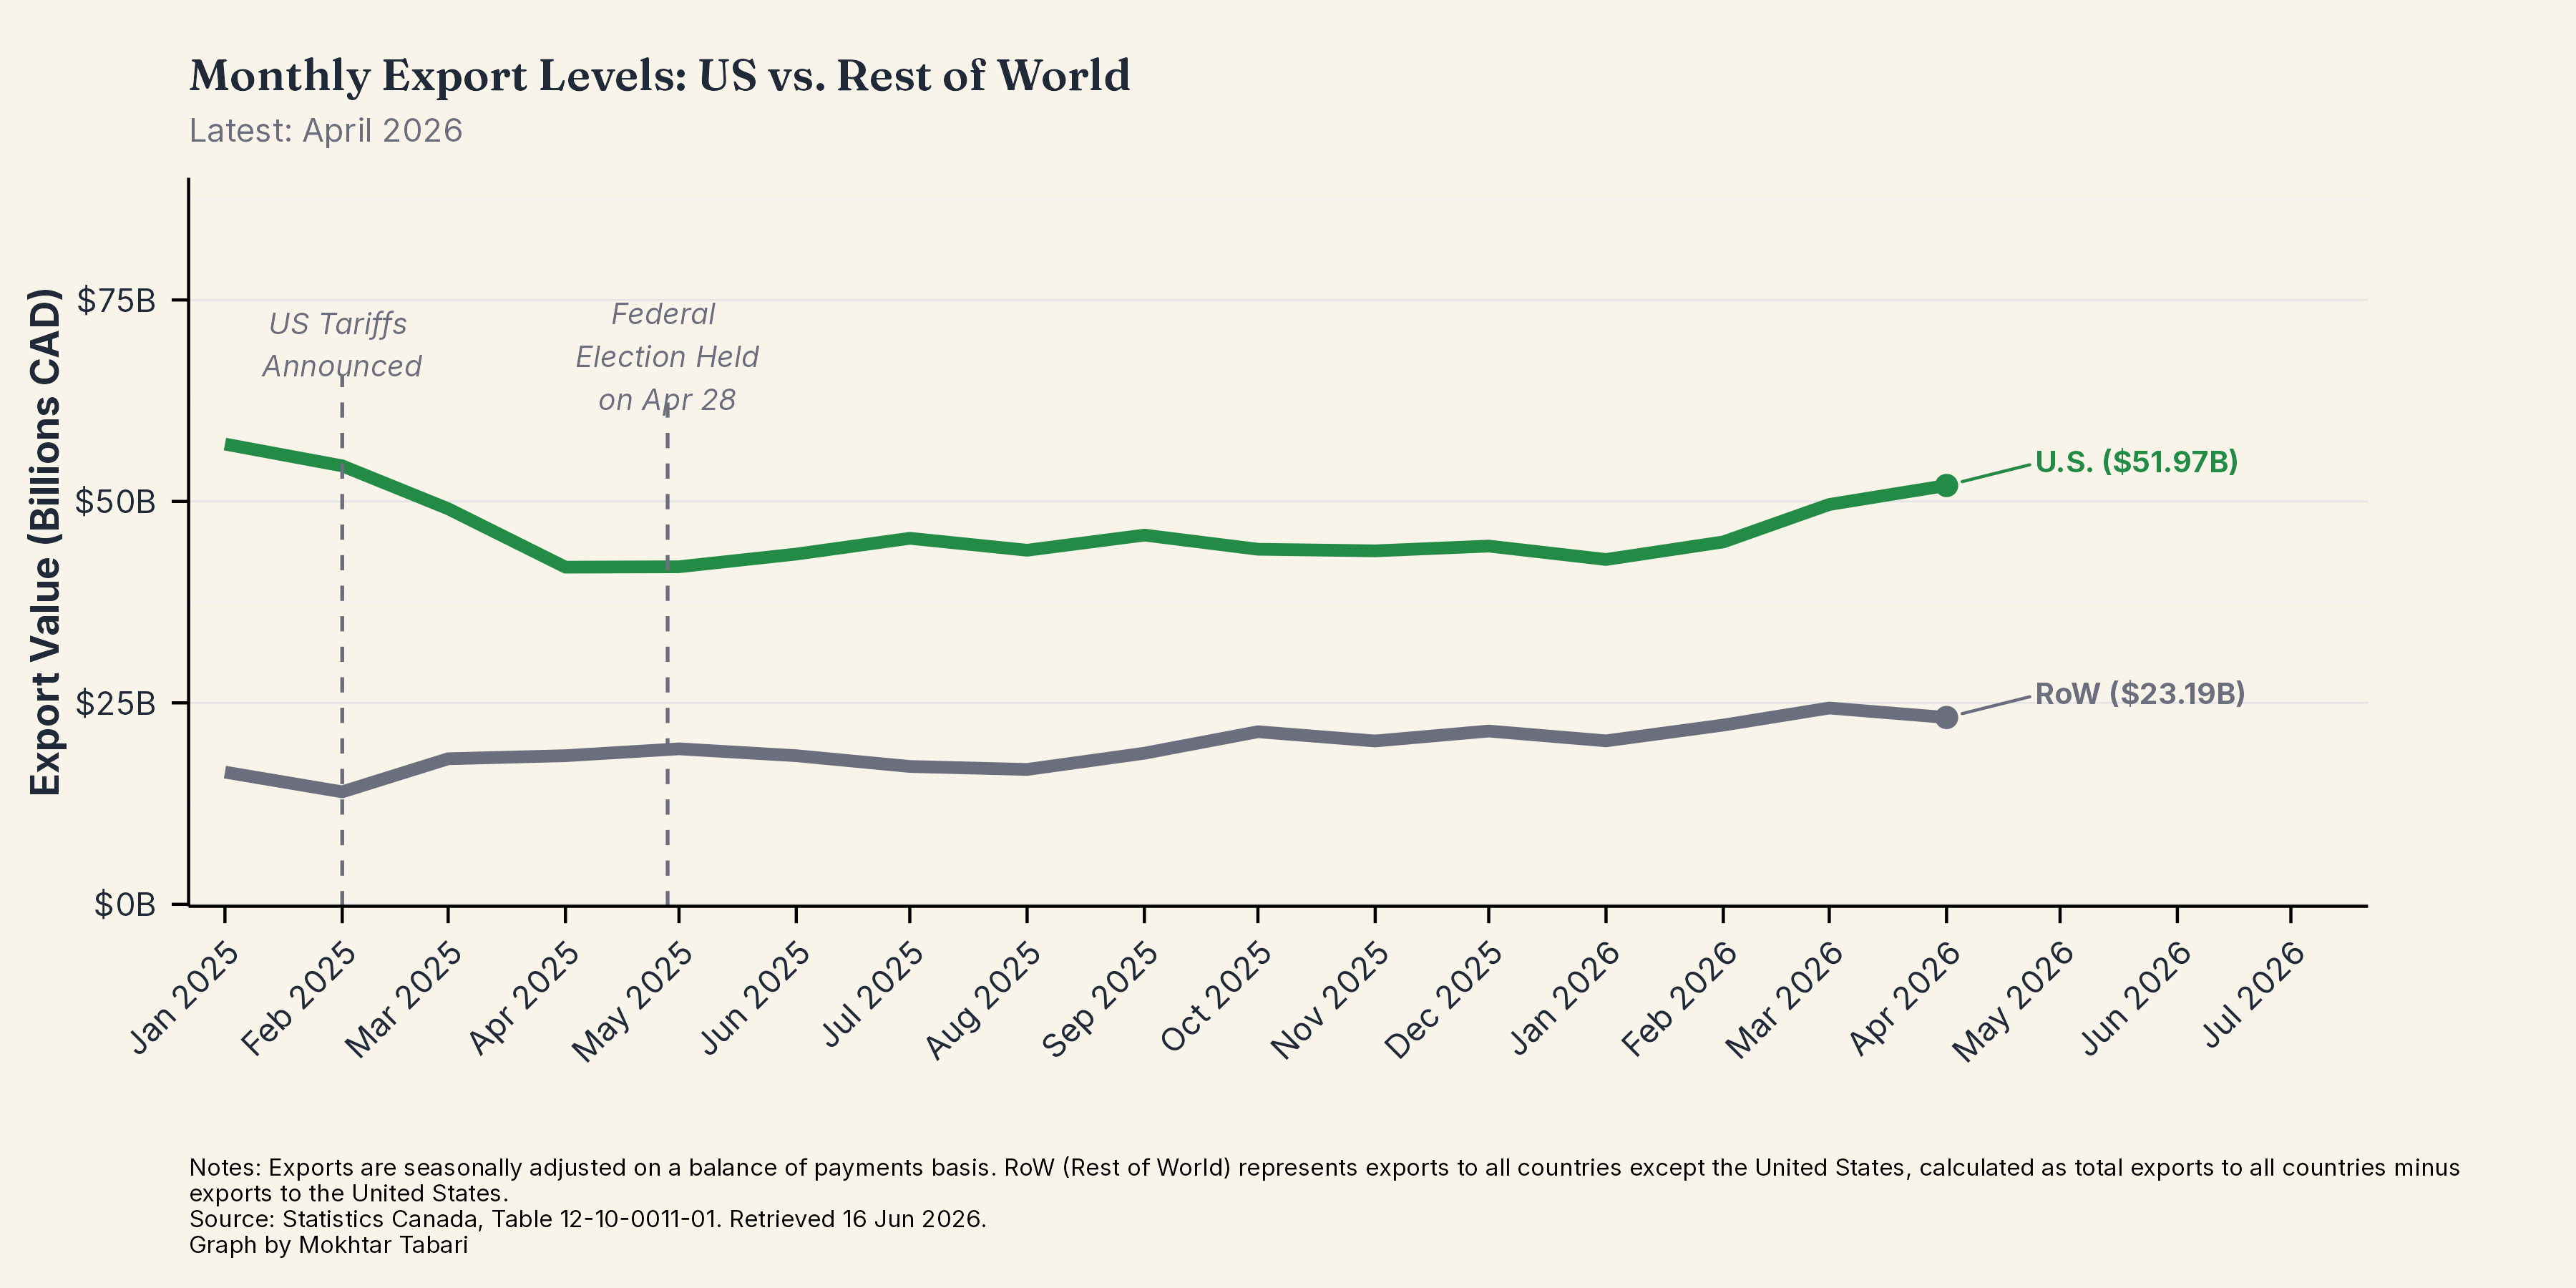
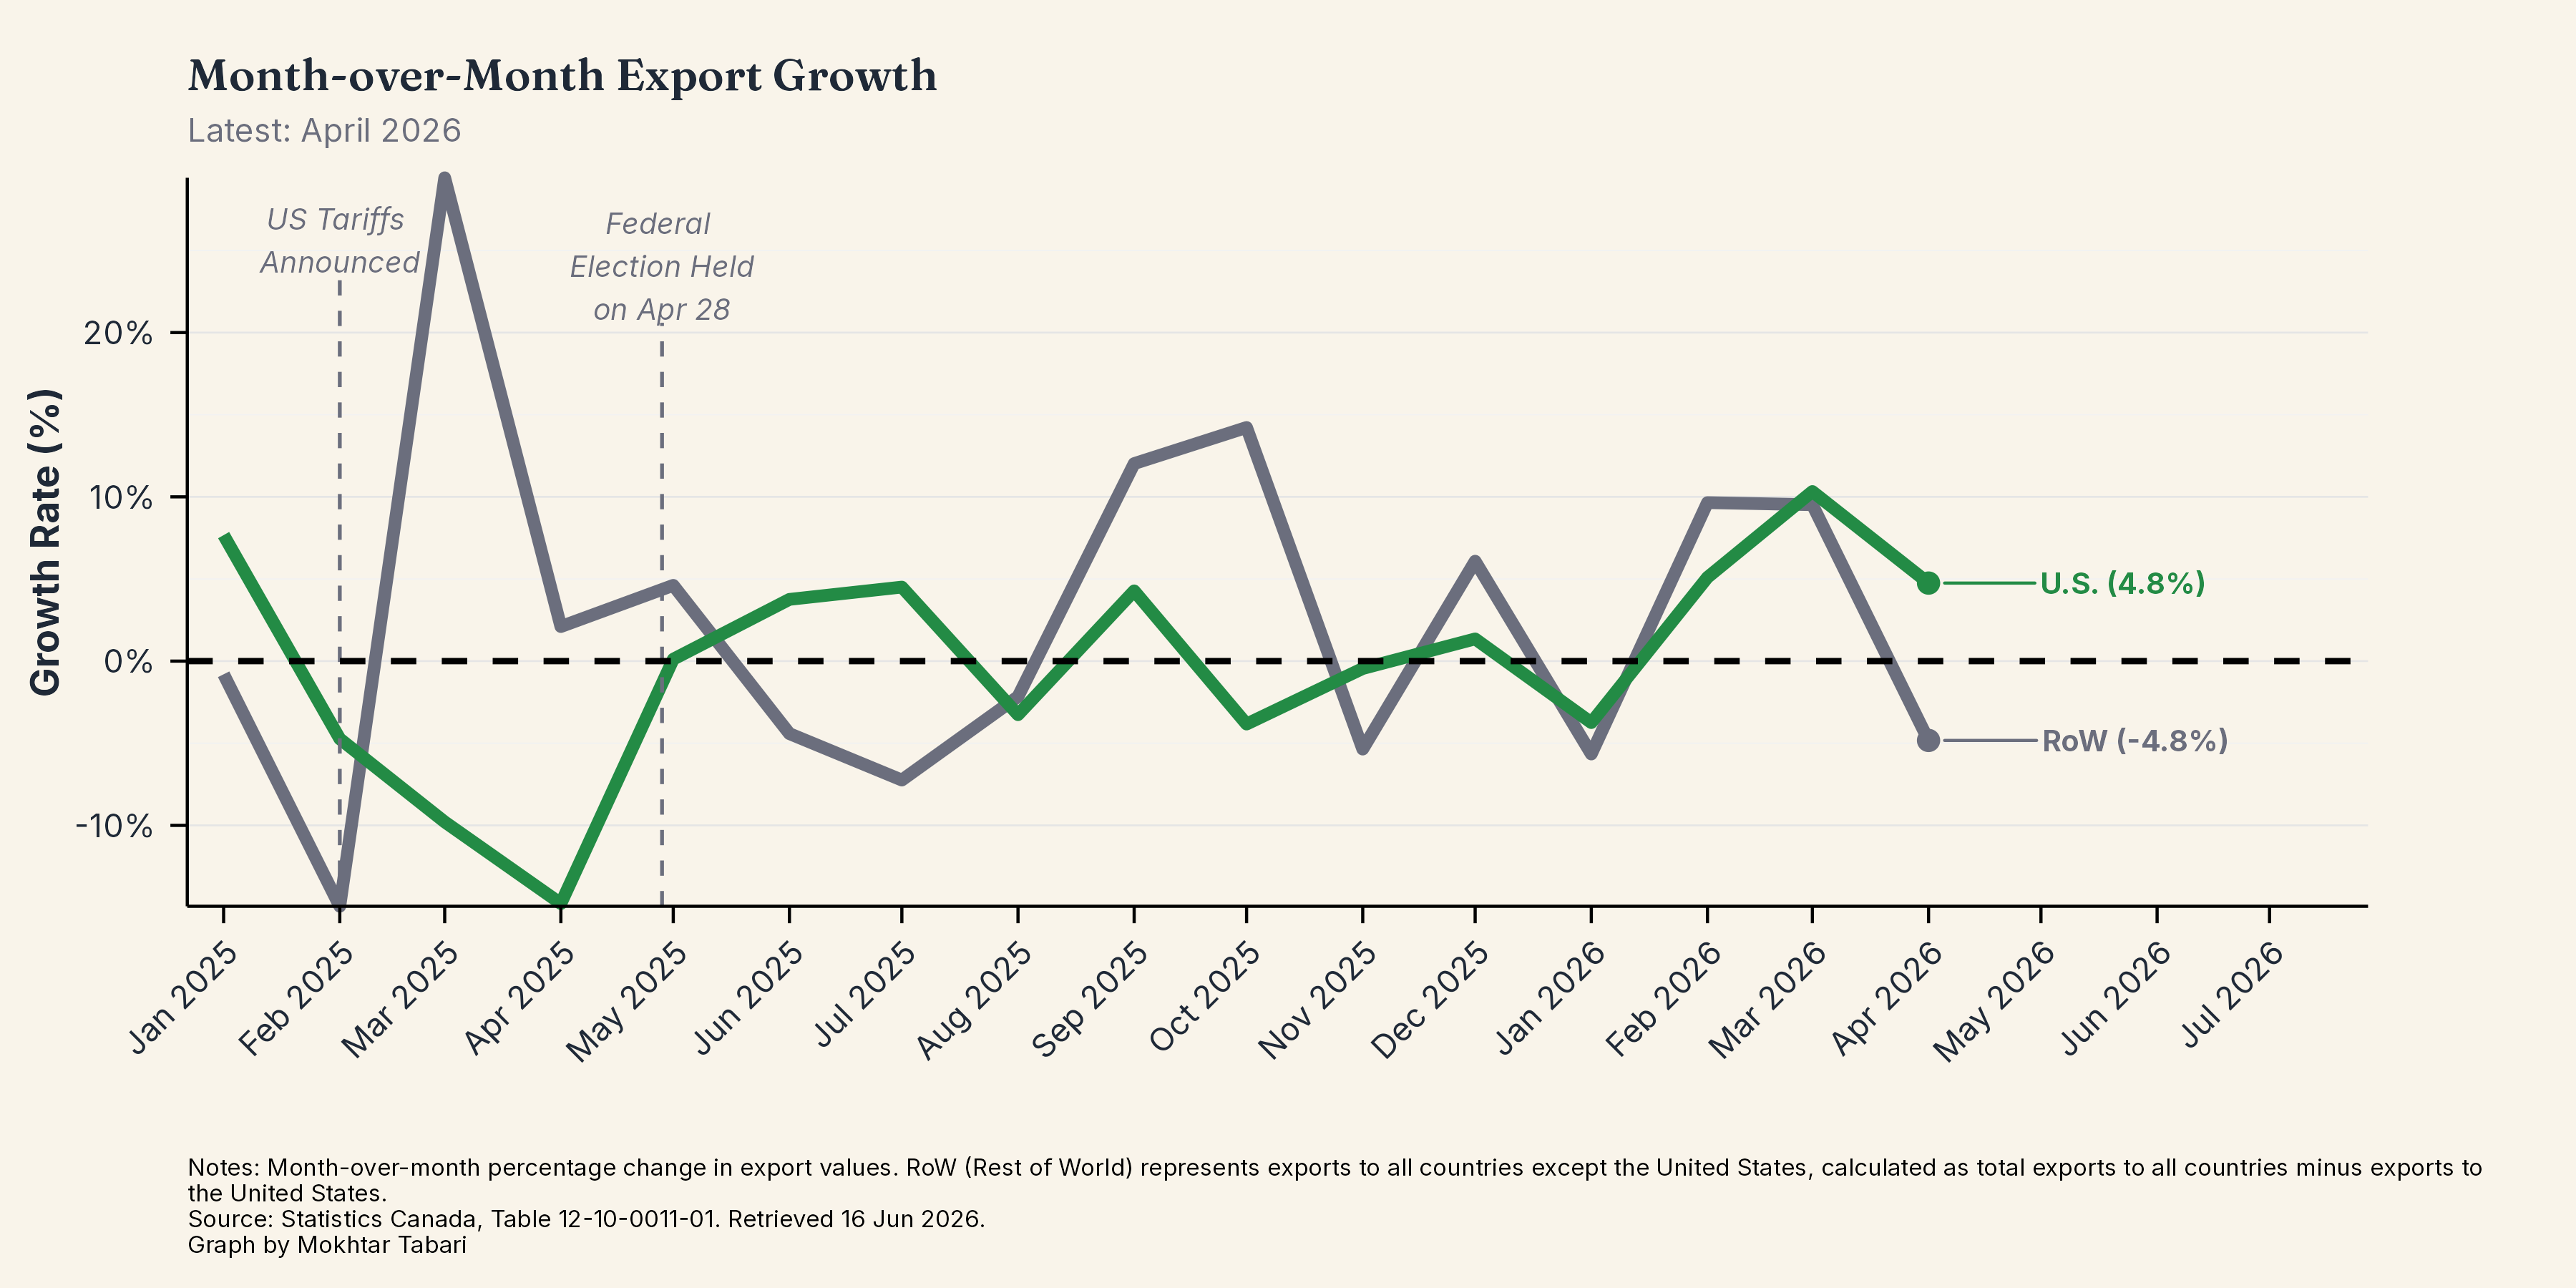
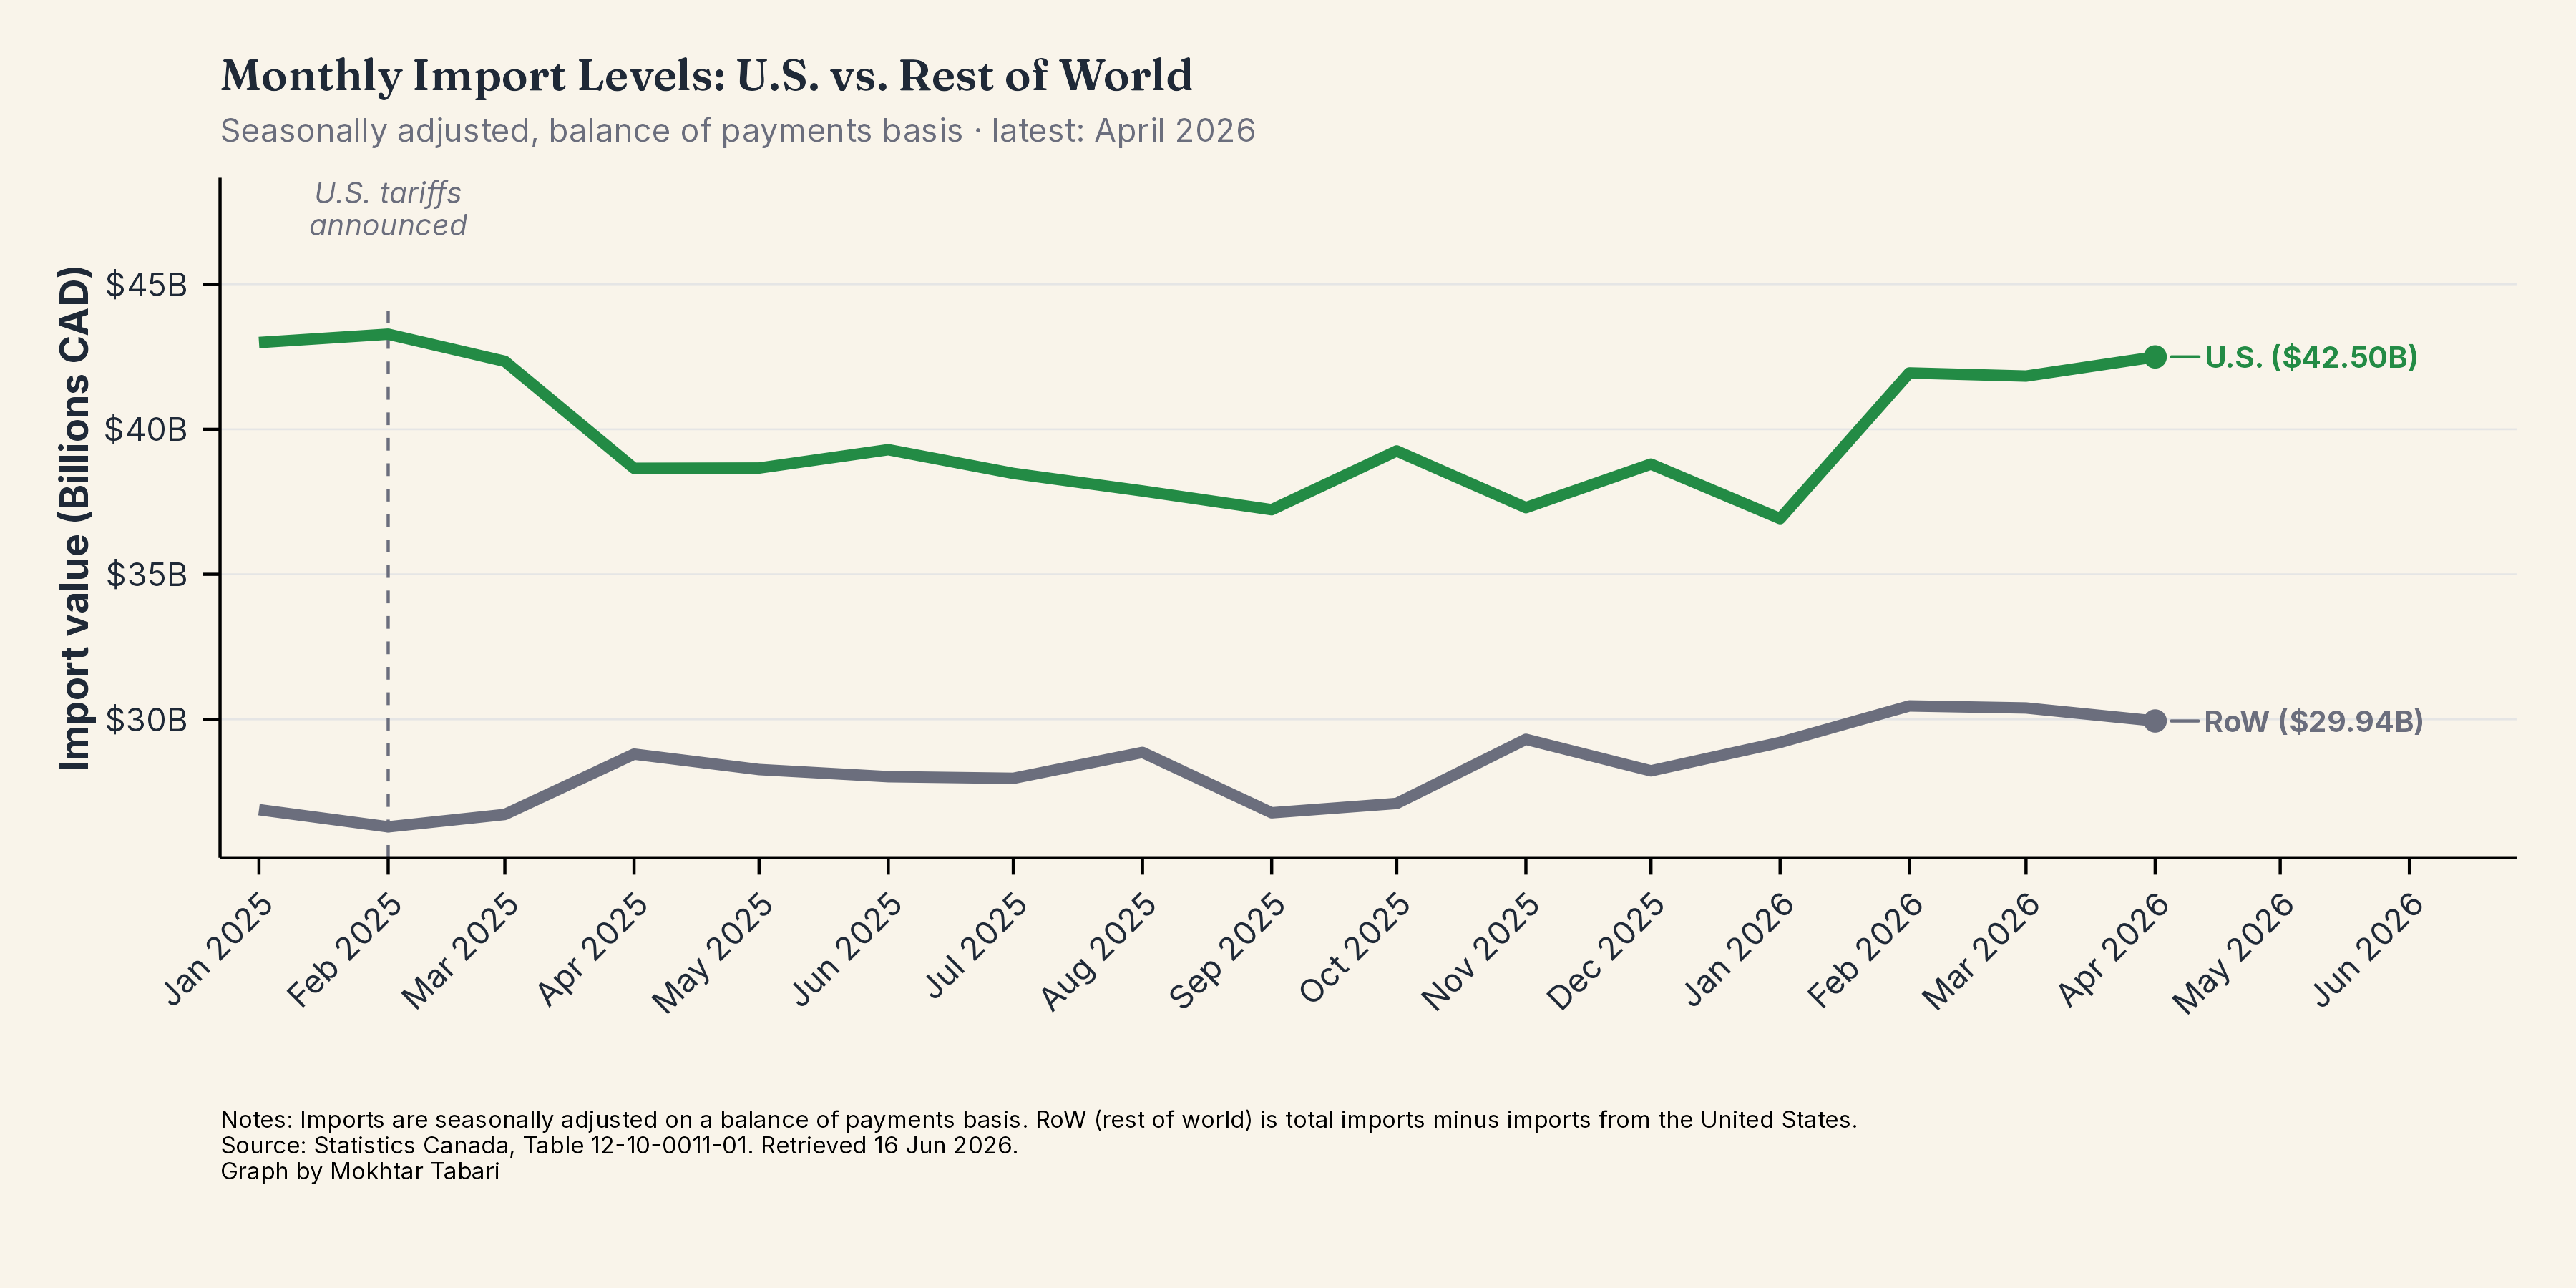
Trade & Exports
6 chartsCanadian merchandise exports — U.S. vs the rest of the world, levels and growth.
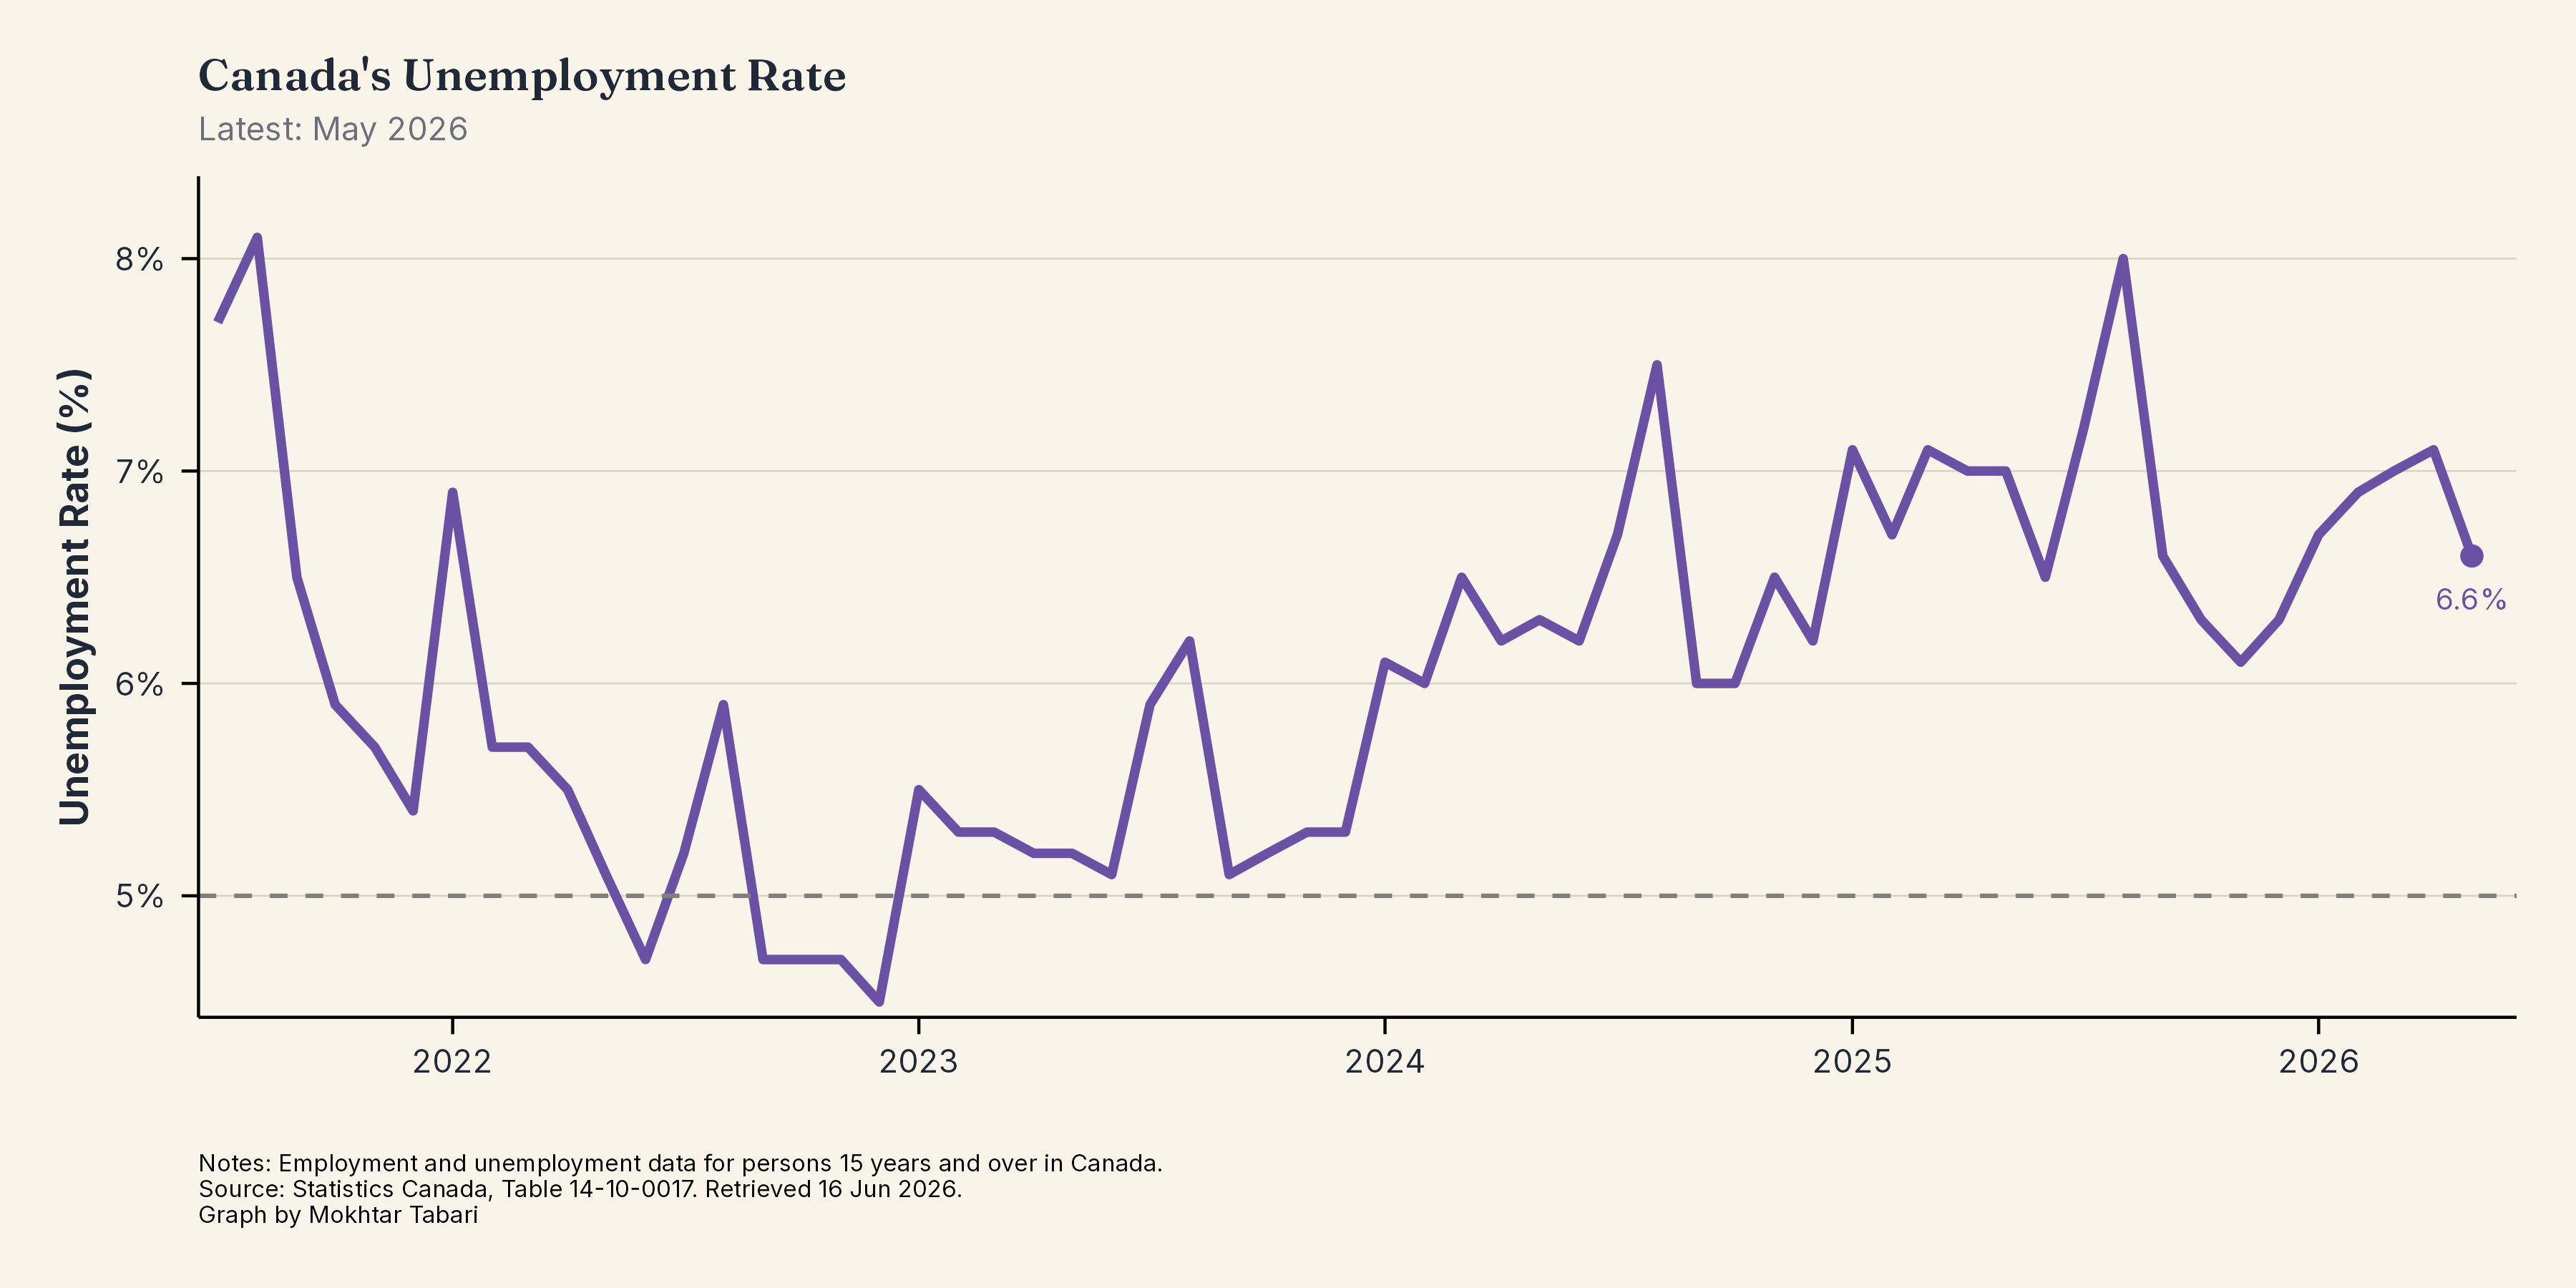
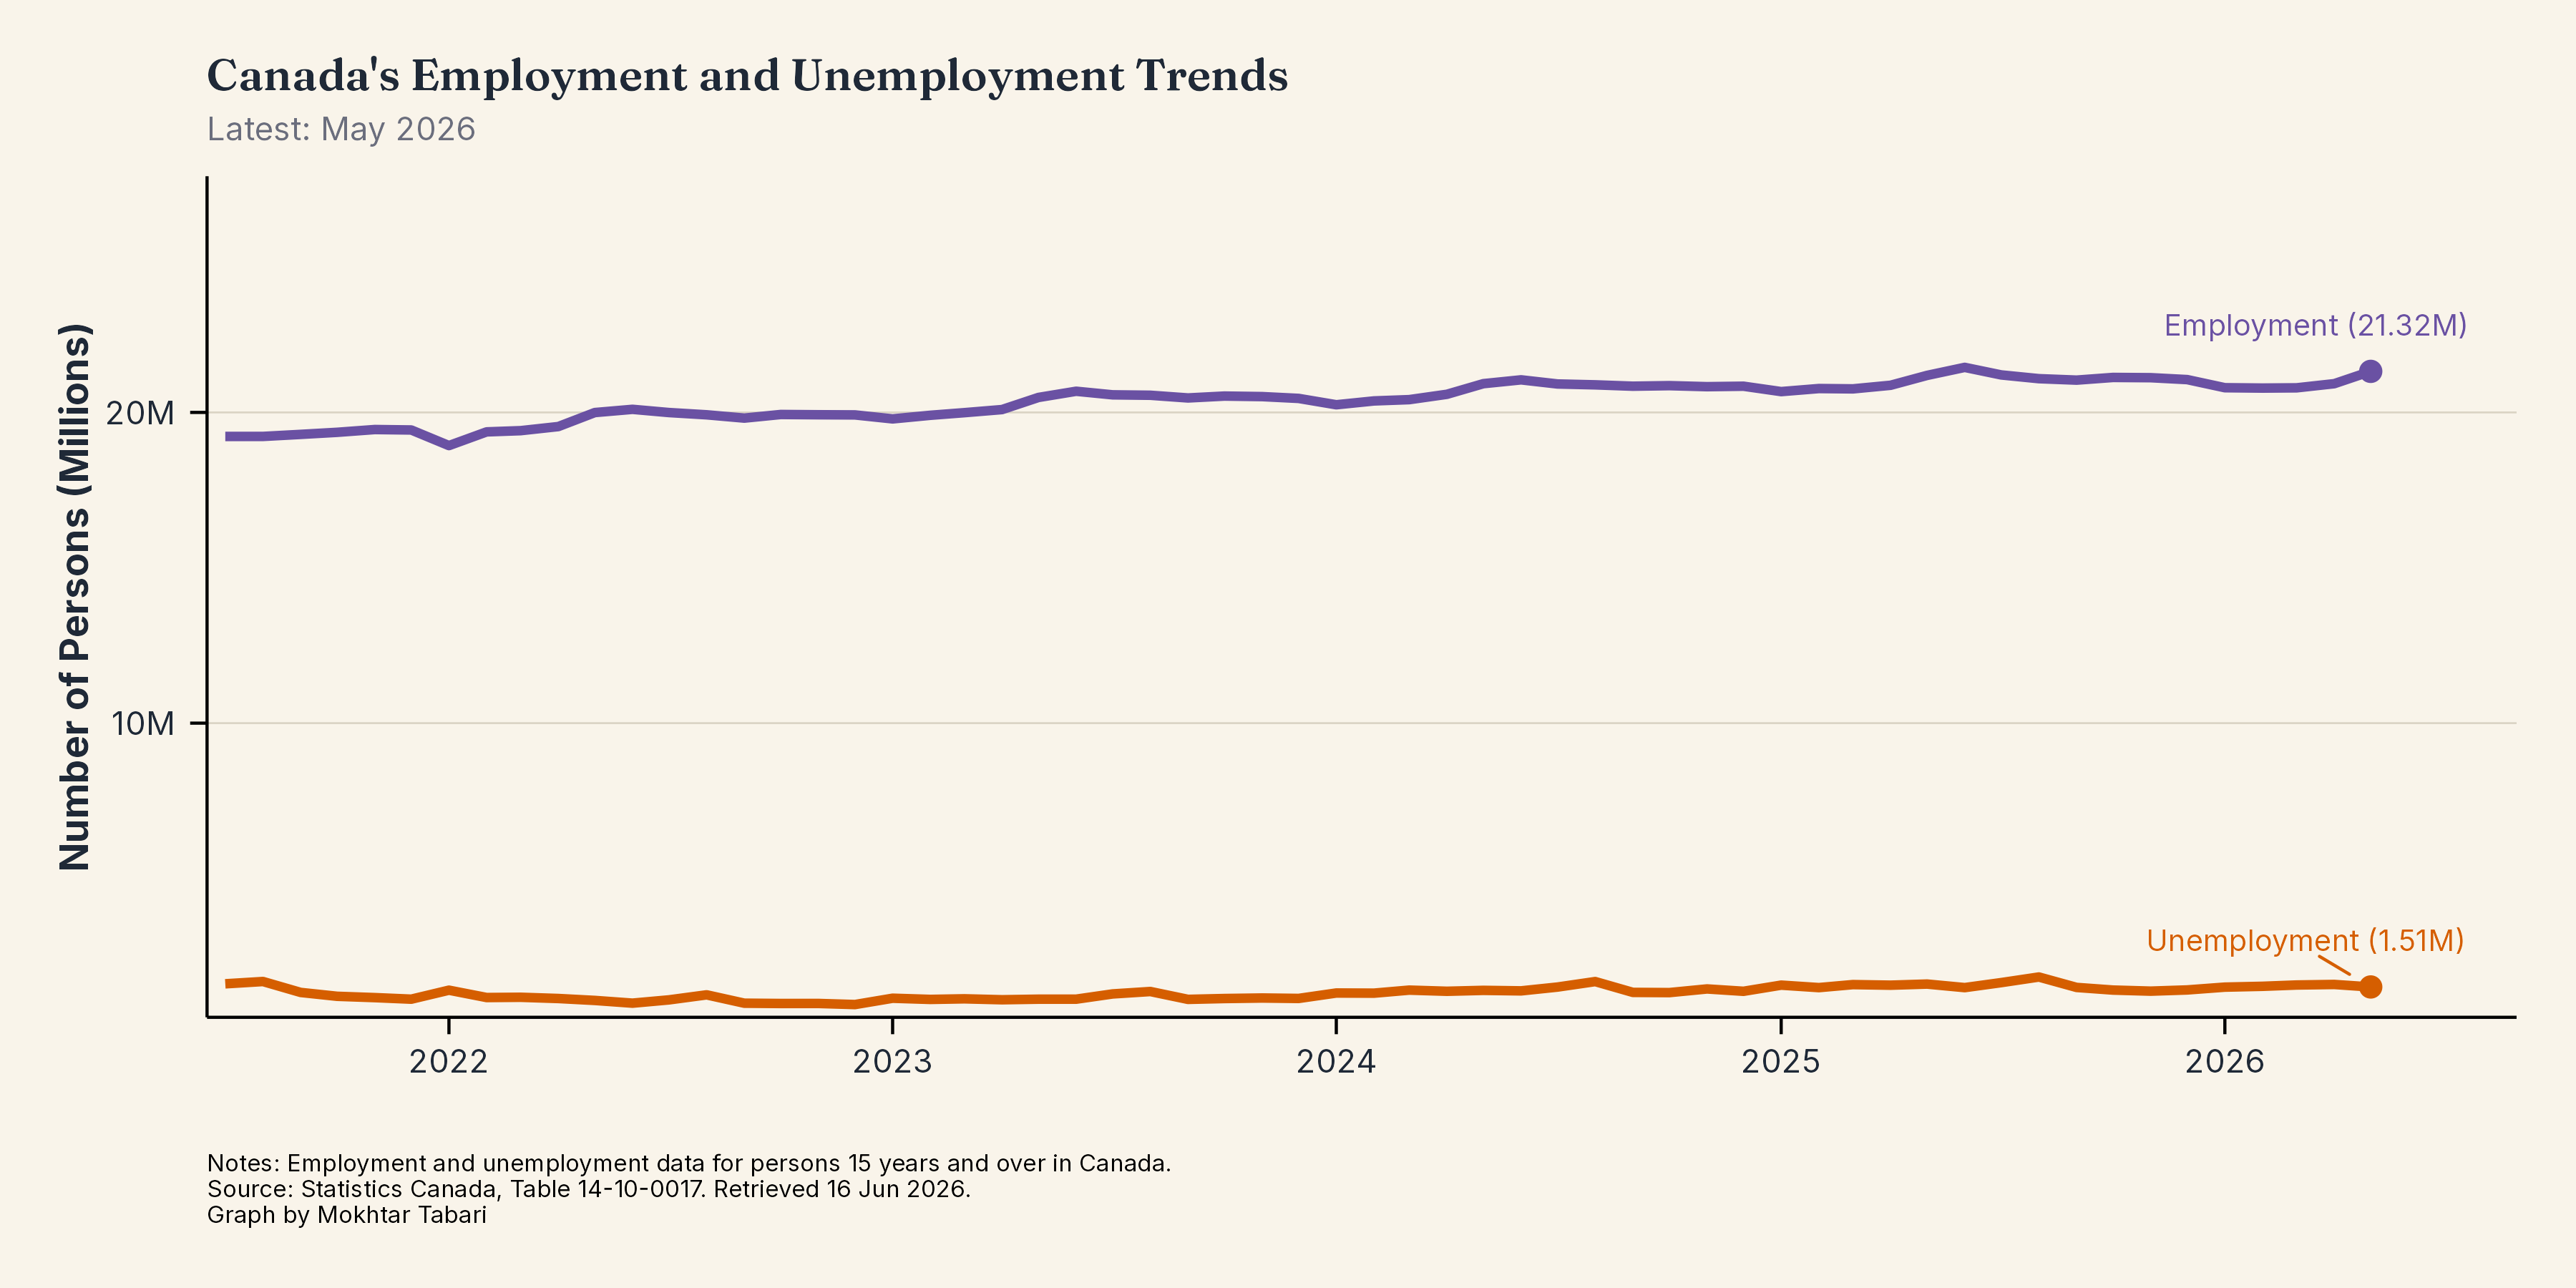
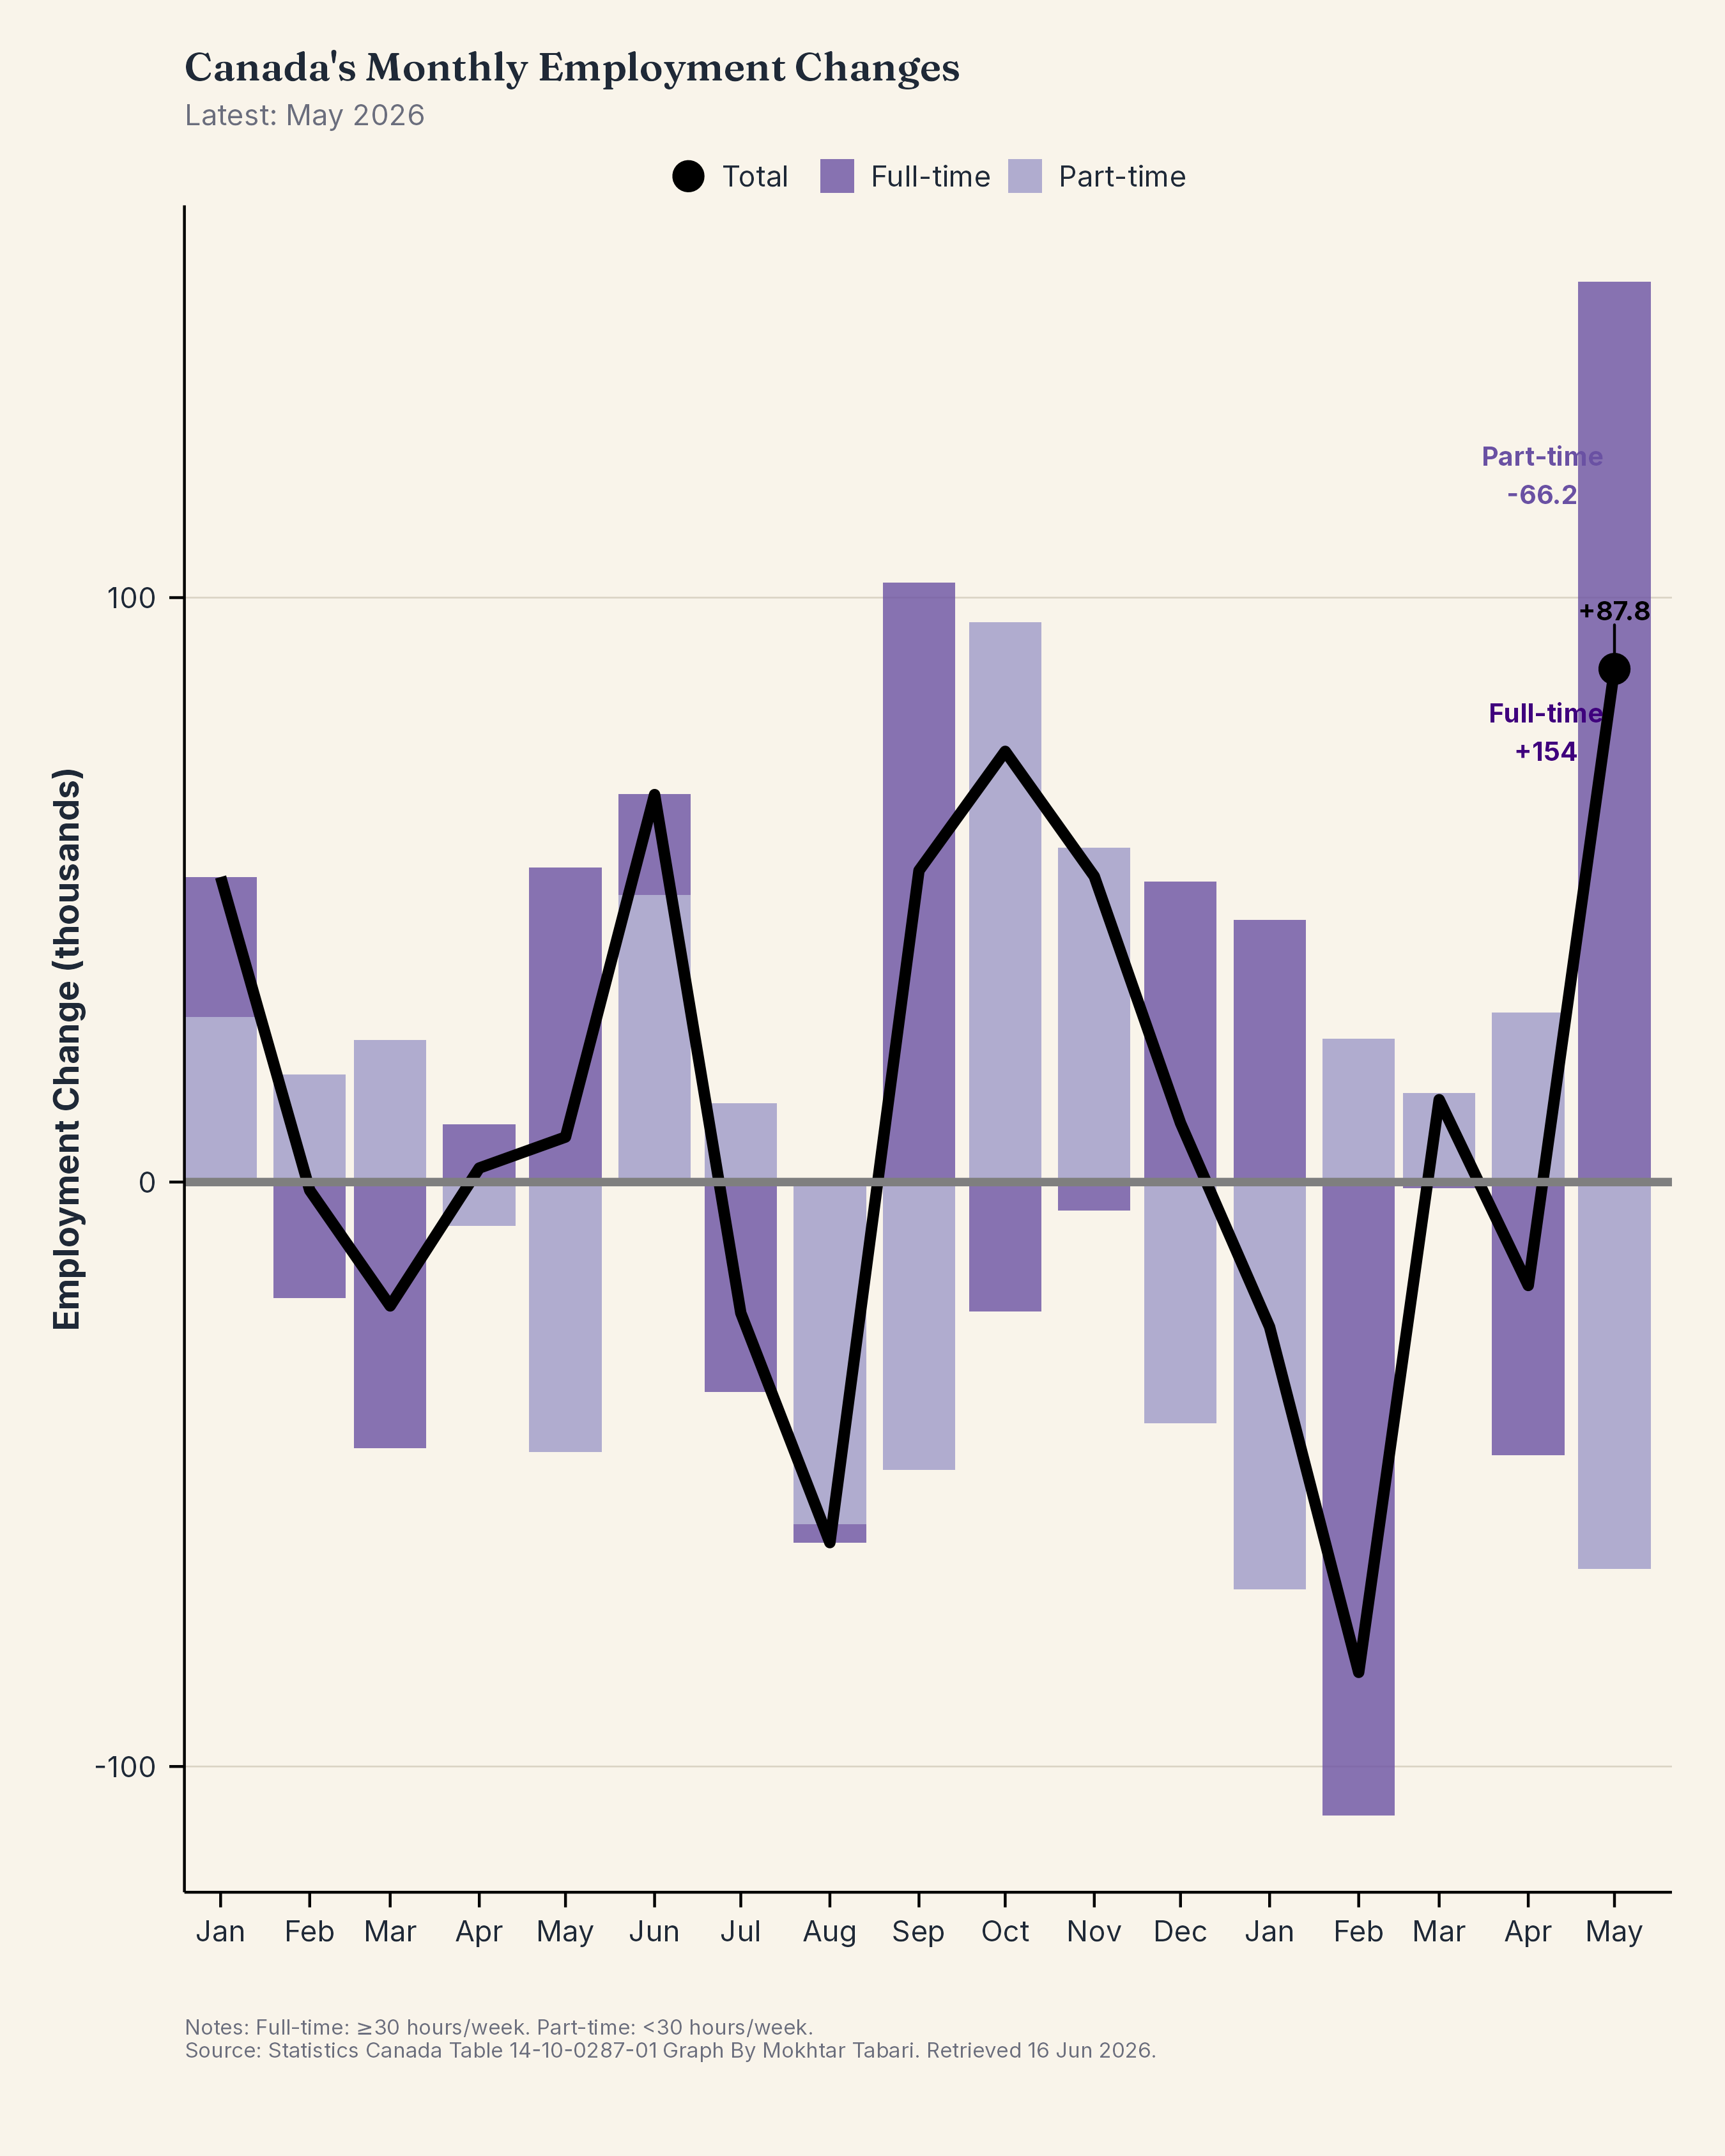
Employment & Labour
8 chartsCanada's labour market — unemployment, employment levels, and participation by age and industry.
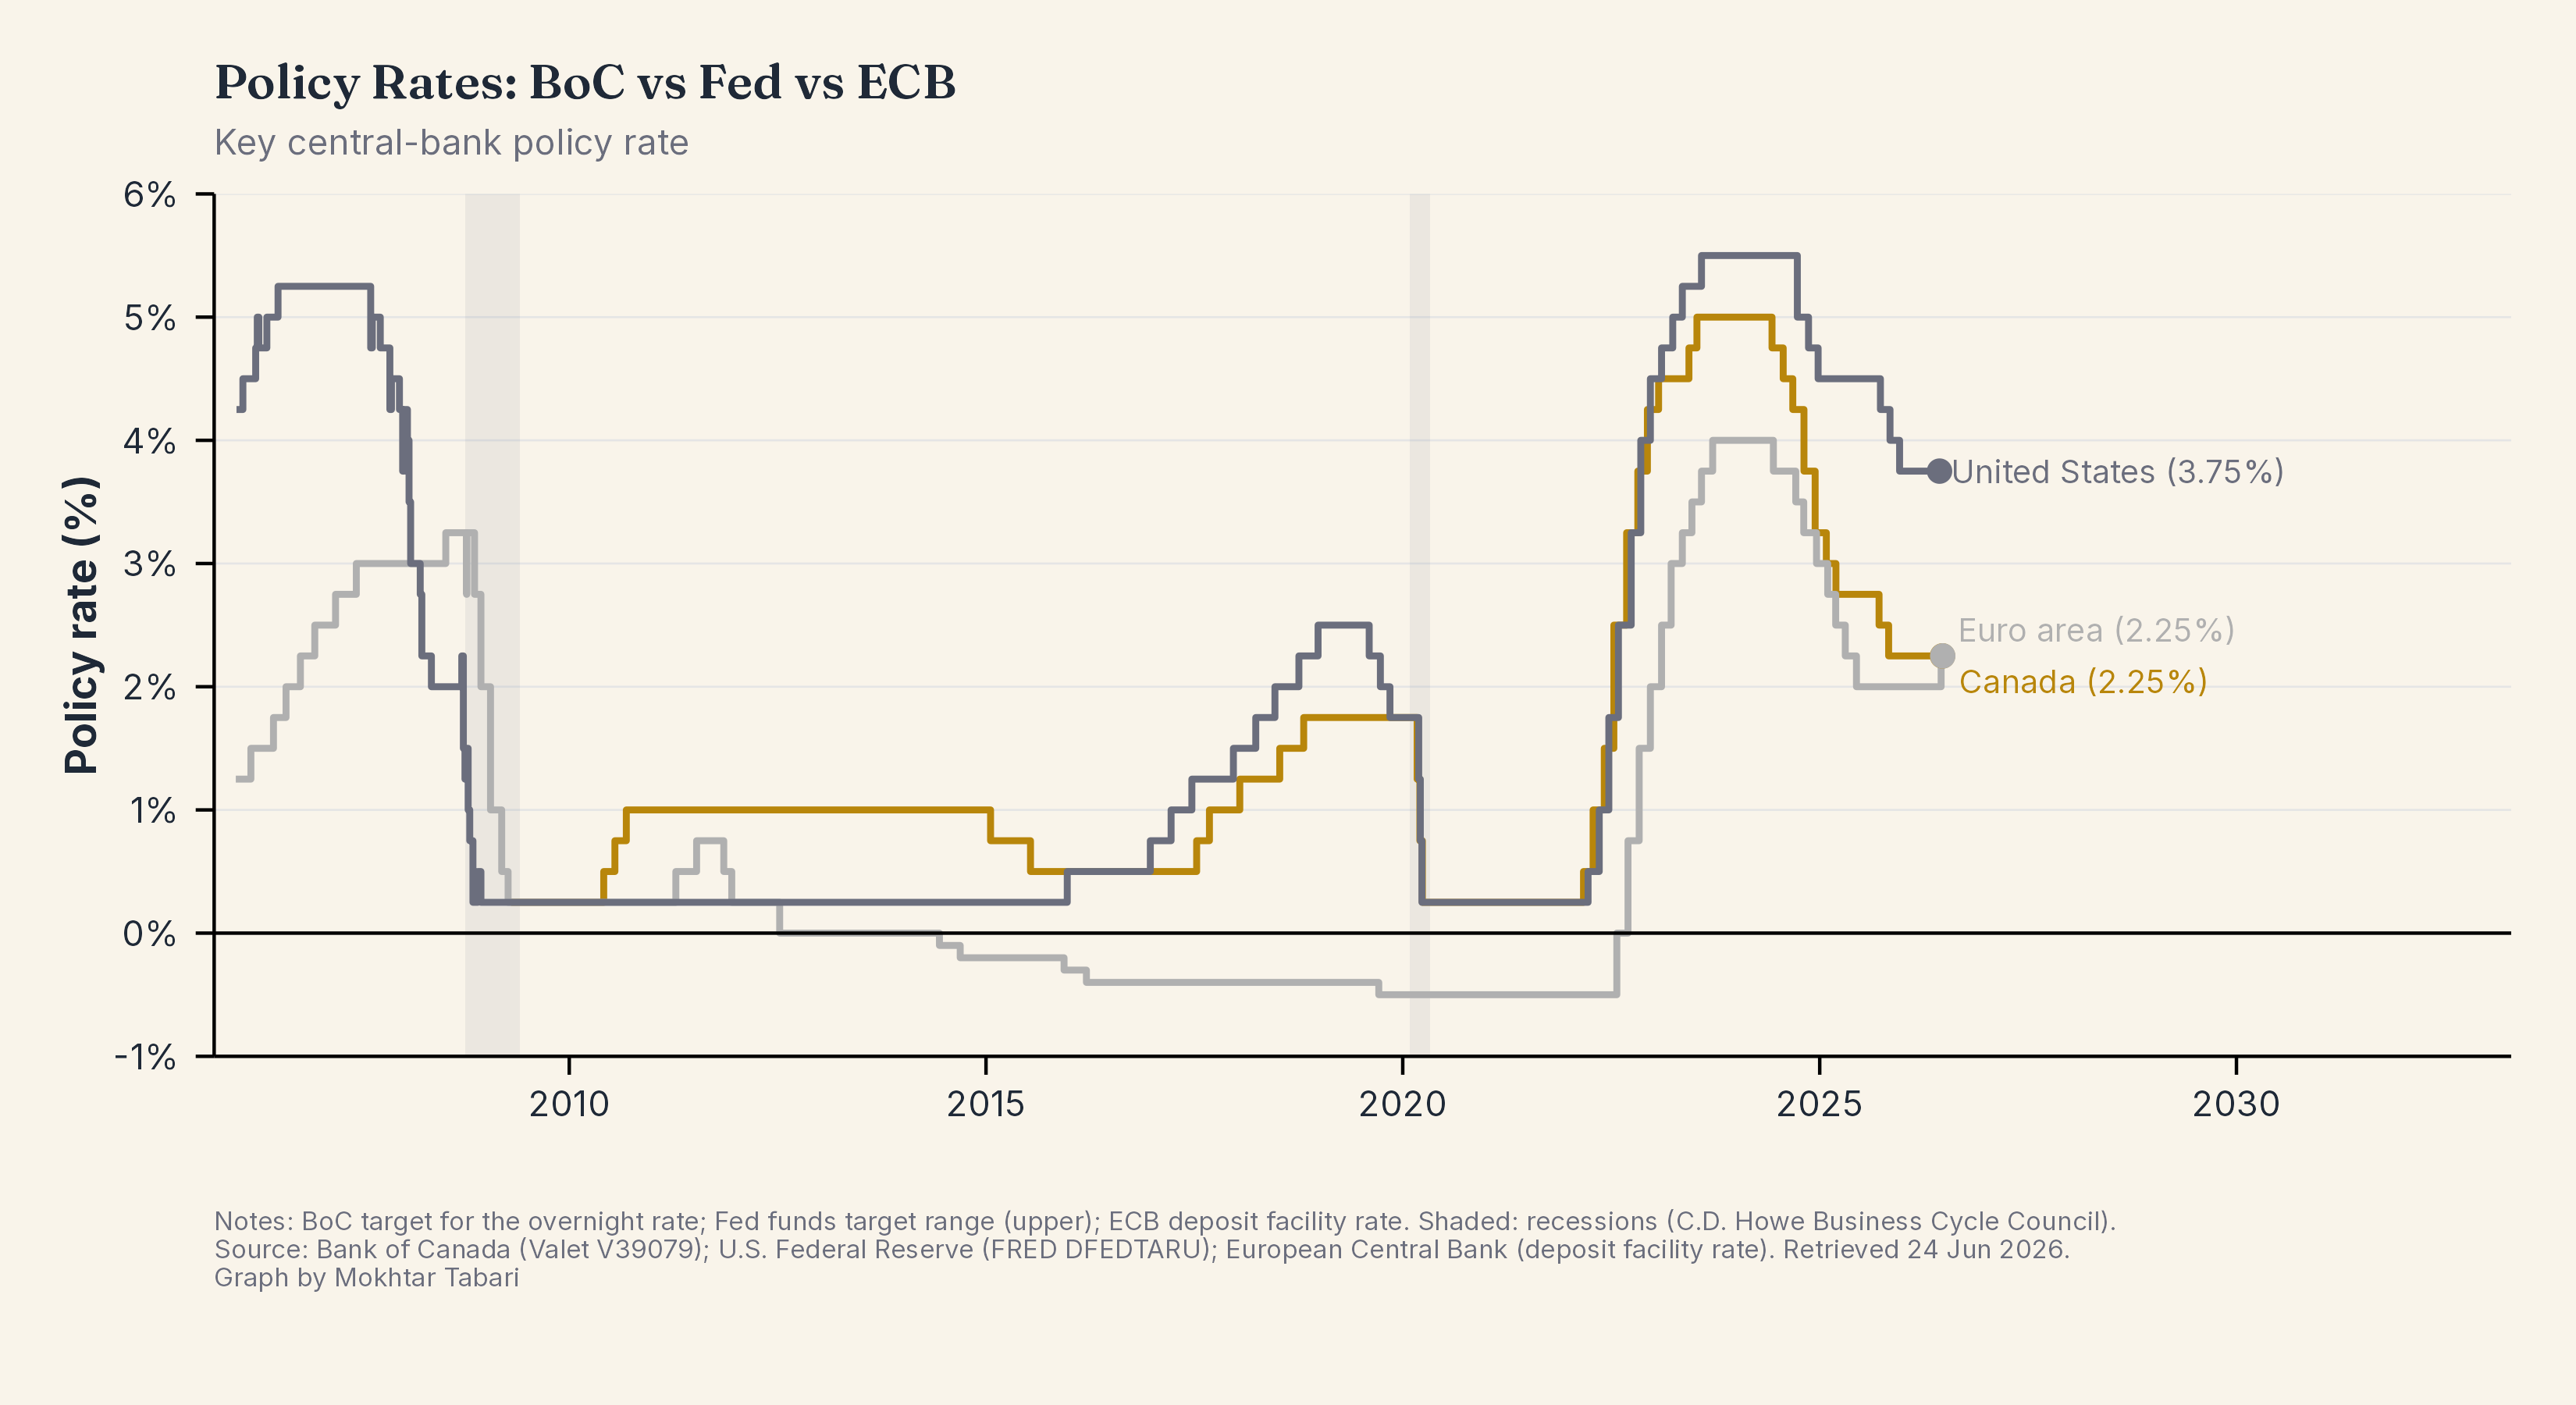
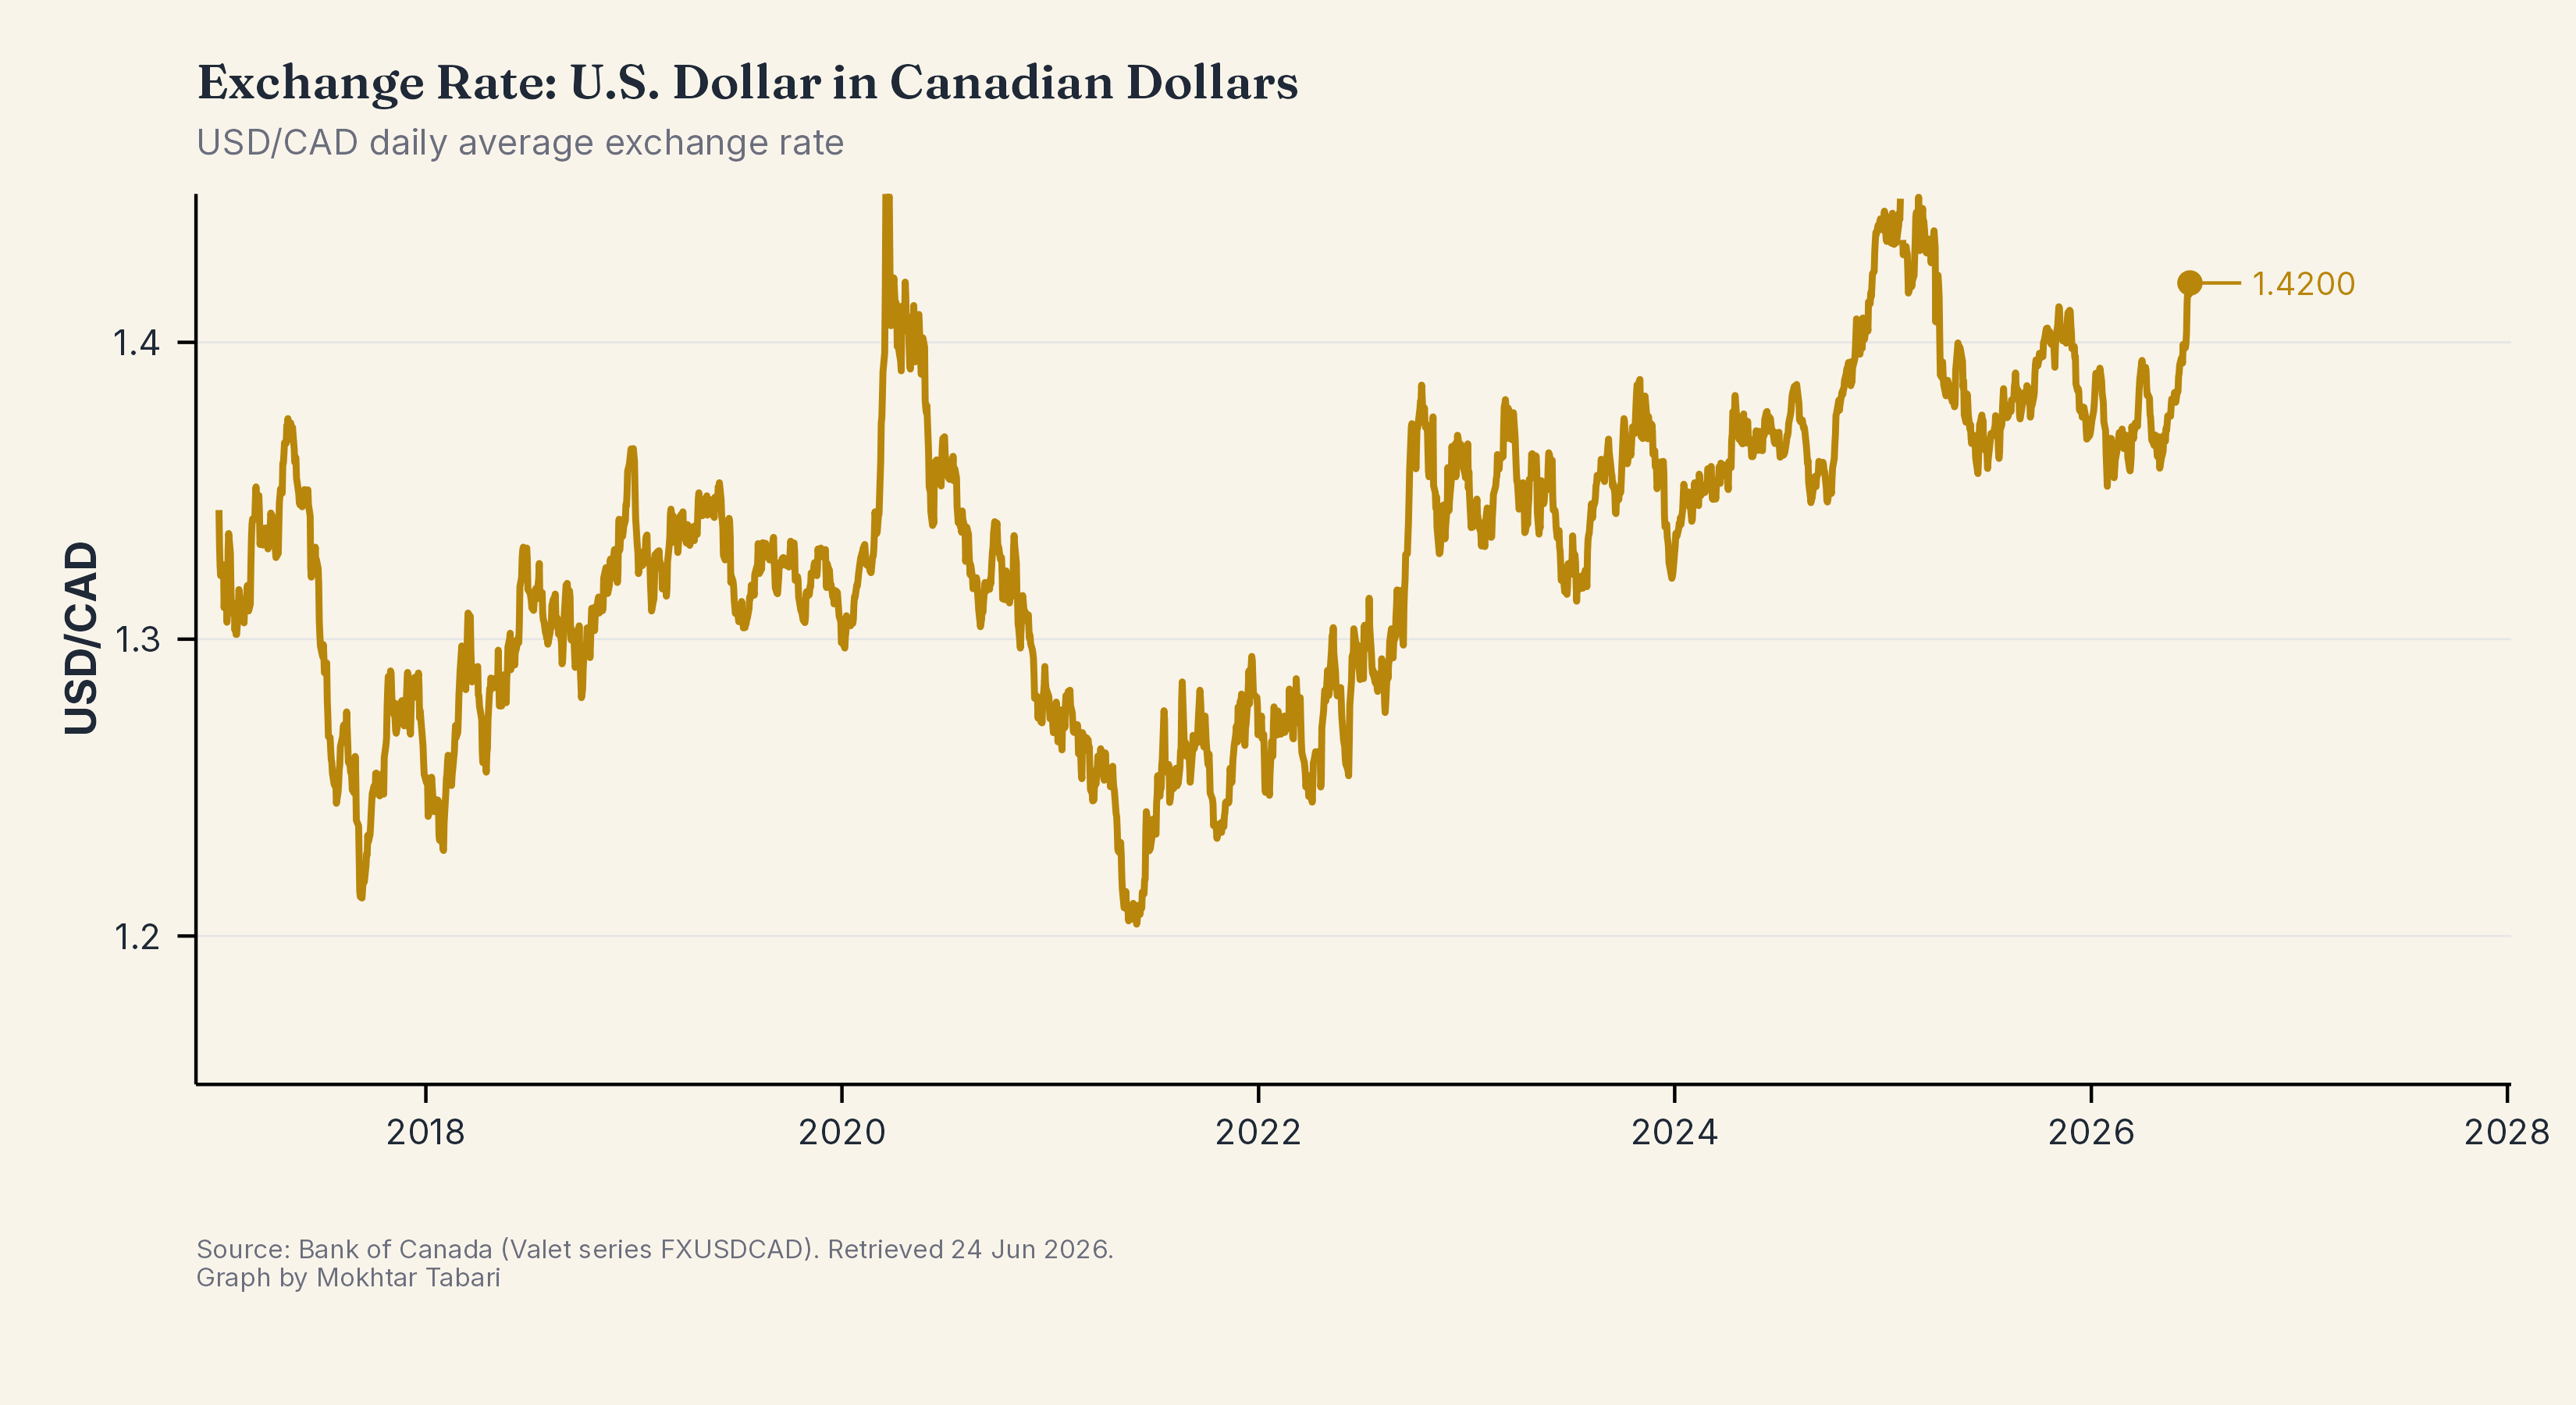
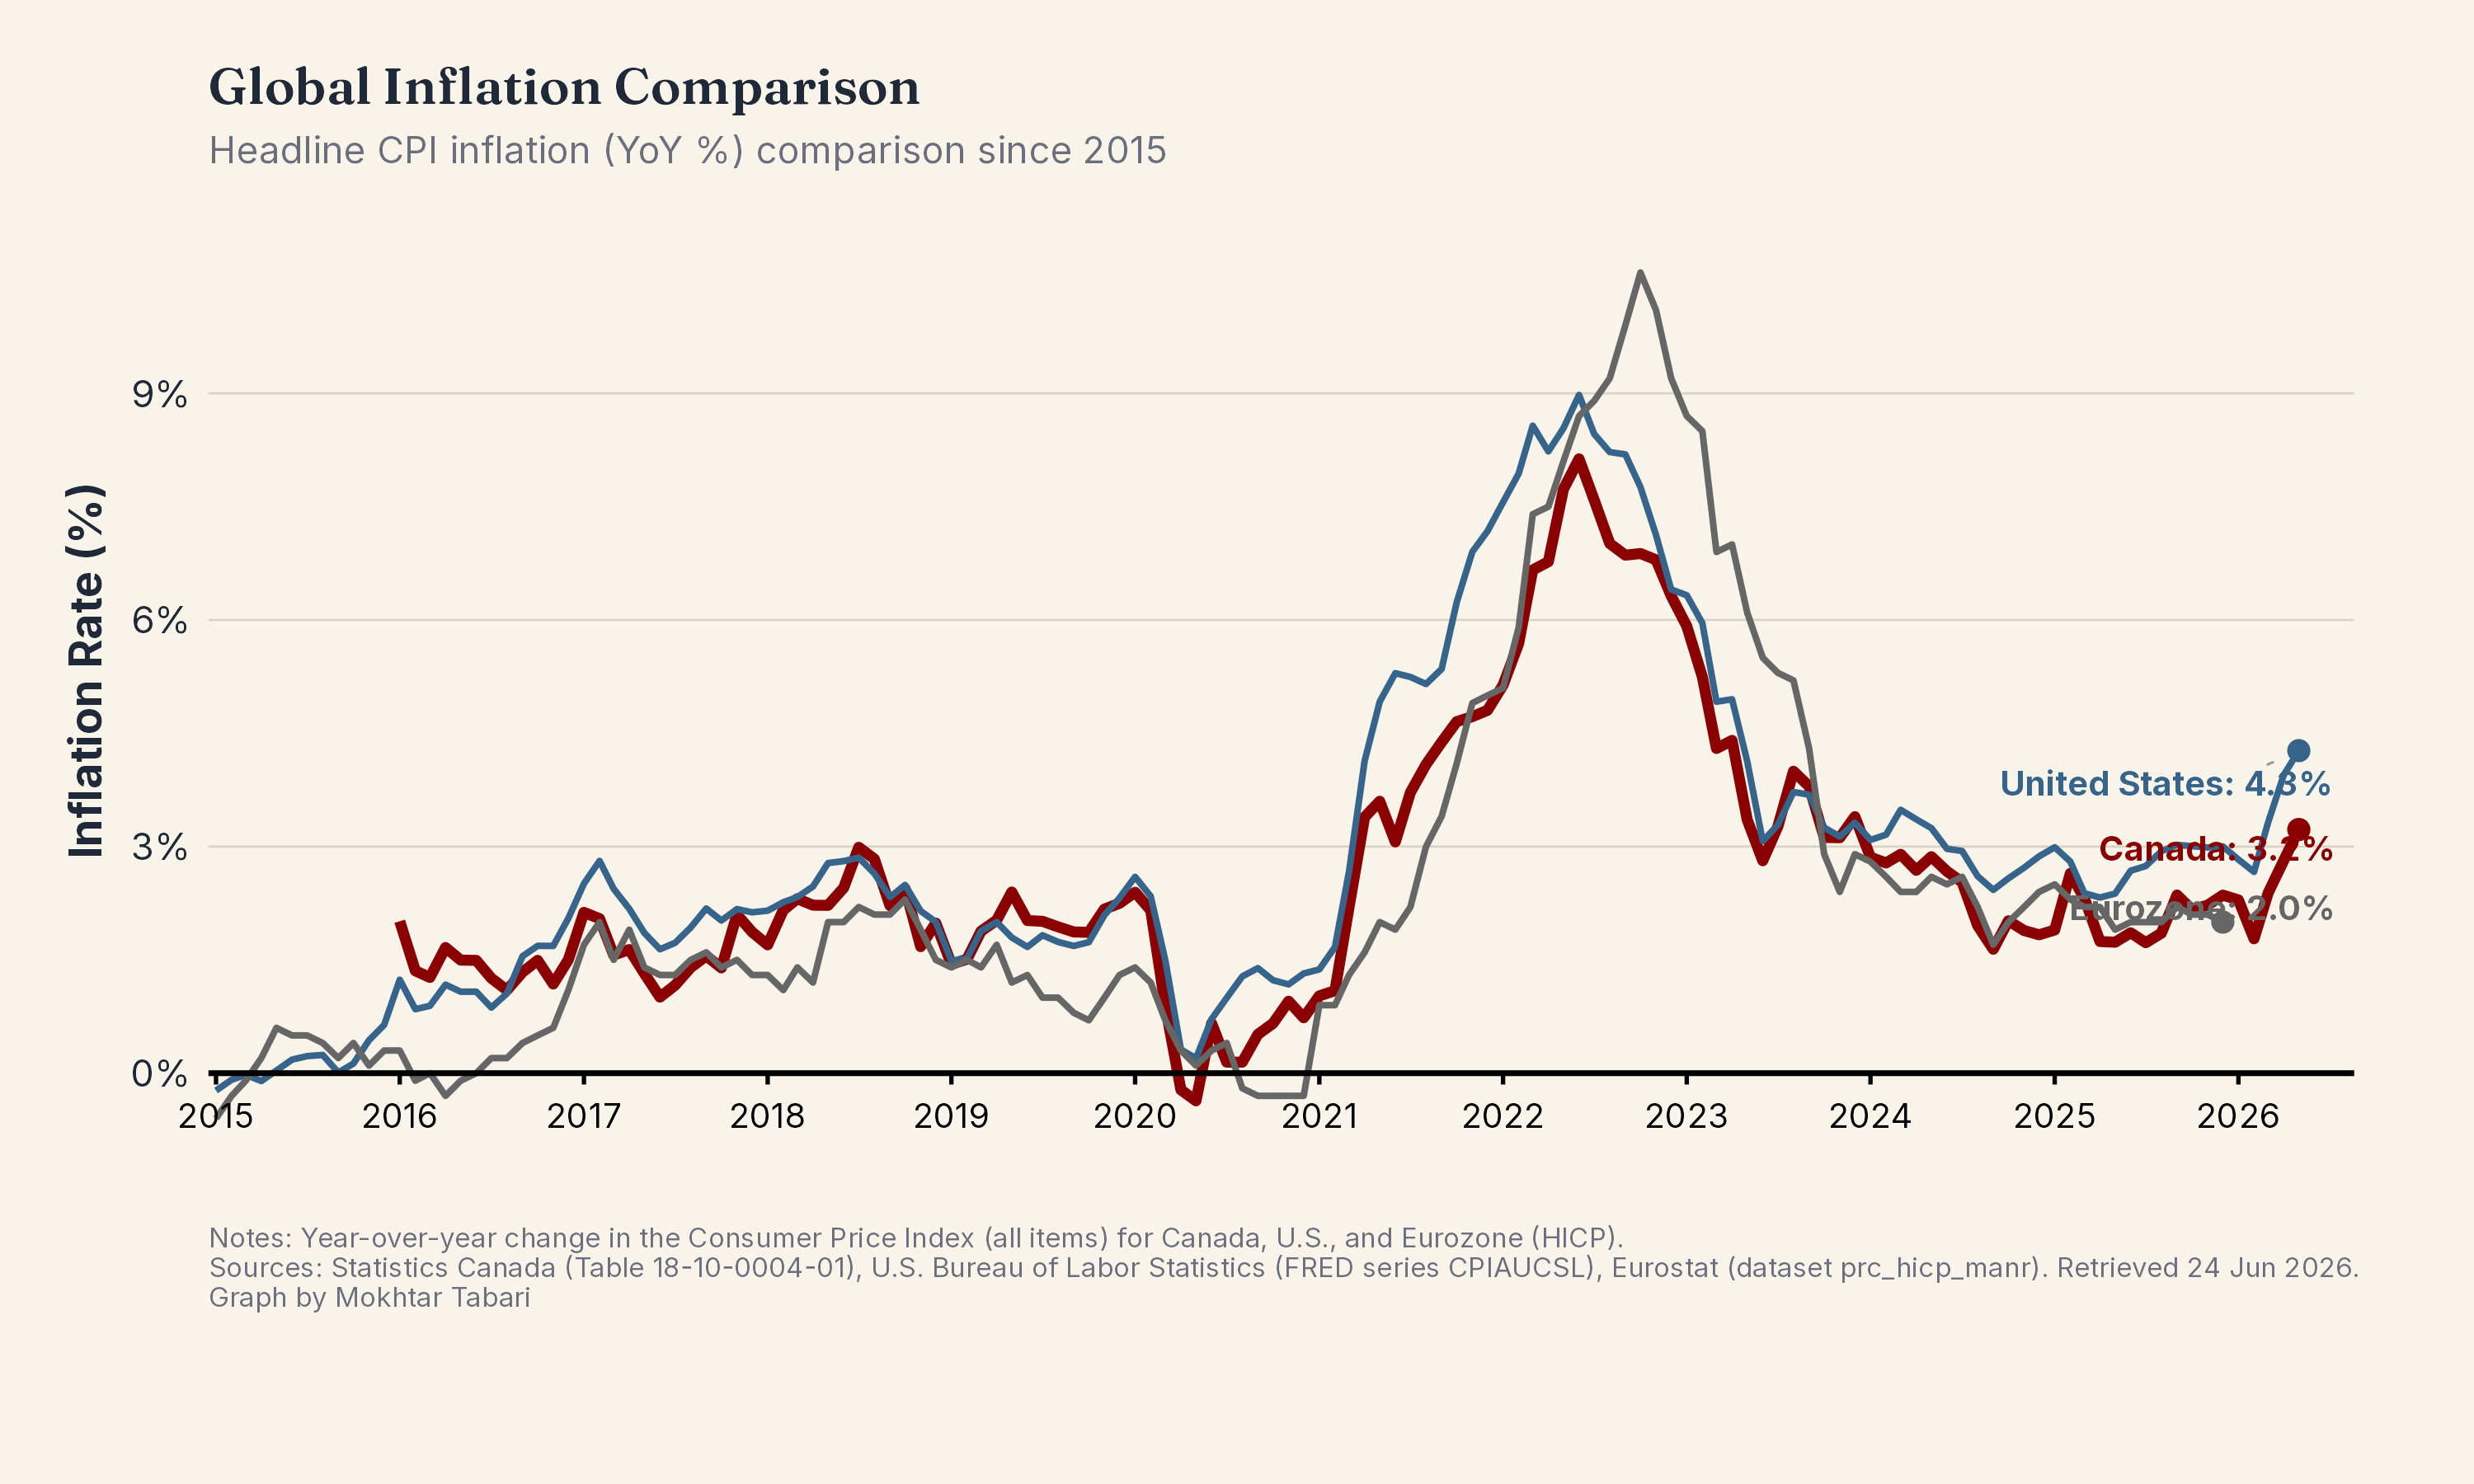
Interest & Exchange Rates
3 chartsCentral-bank policy rates, the USD/CAD exchange rate, and cross-country inflation.
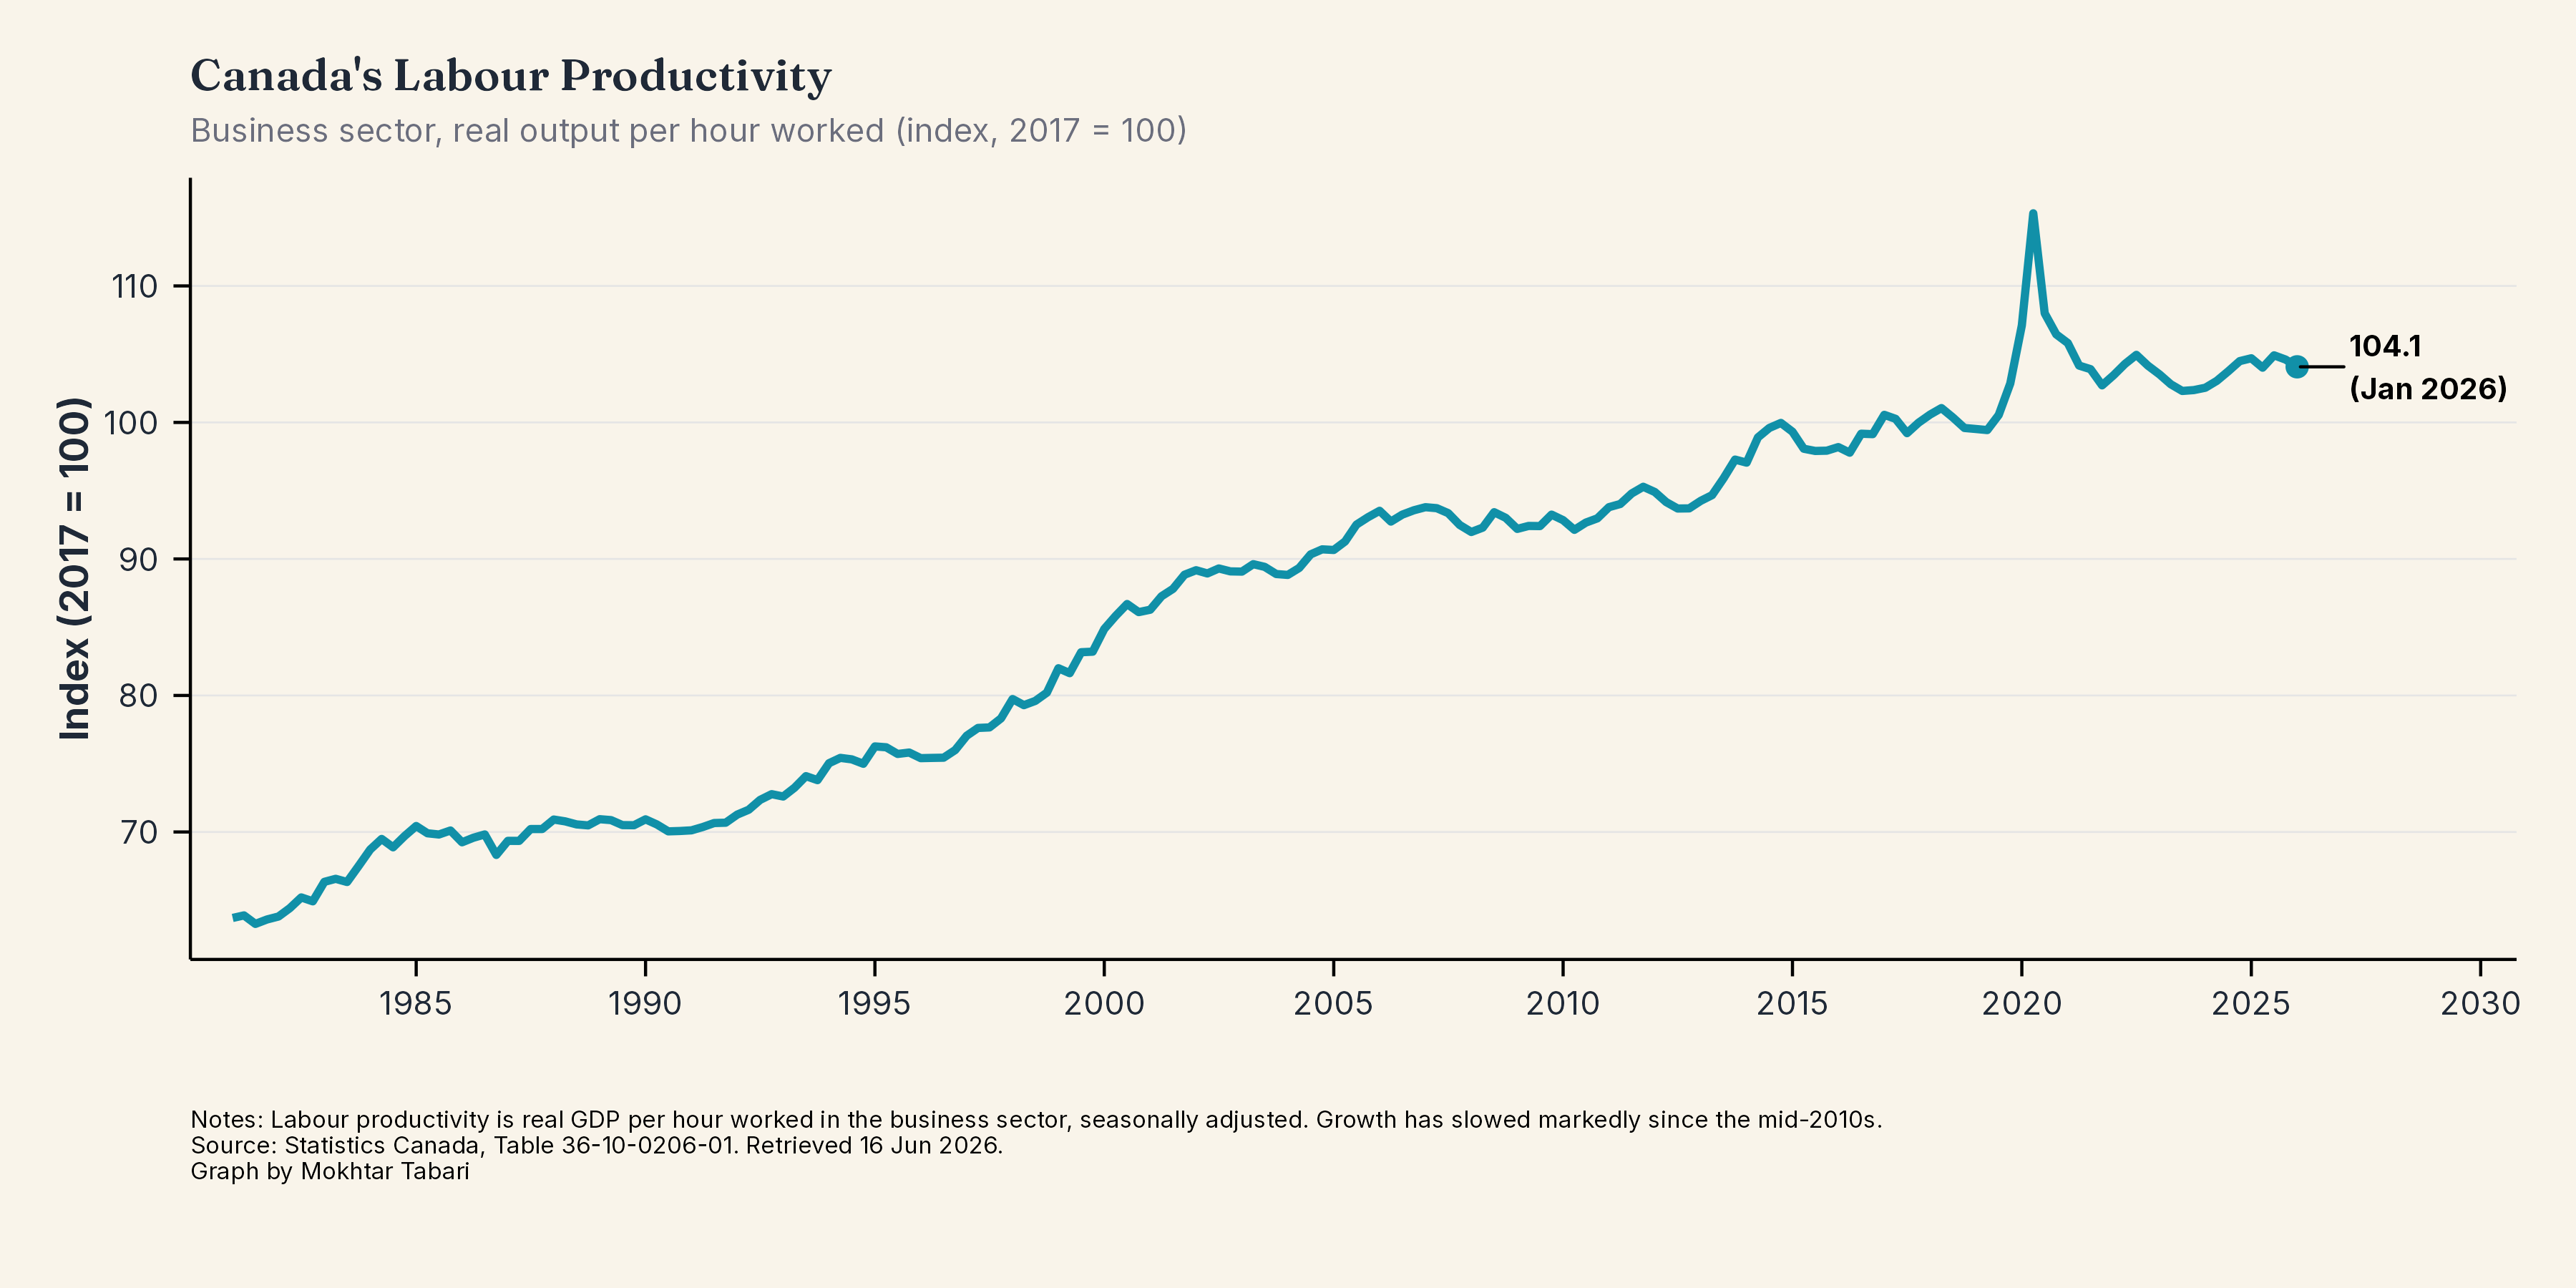
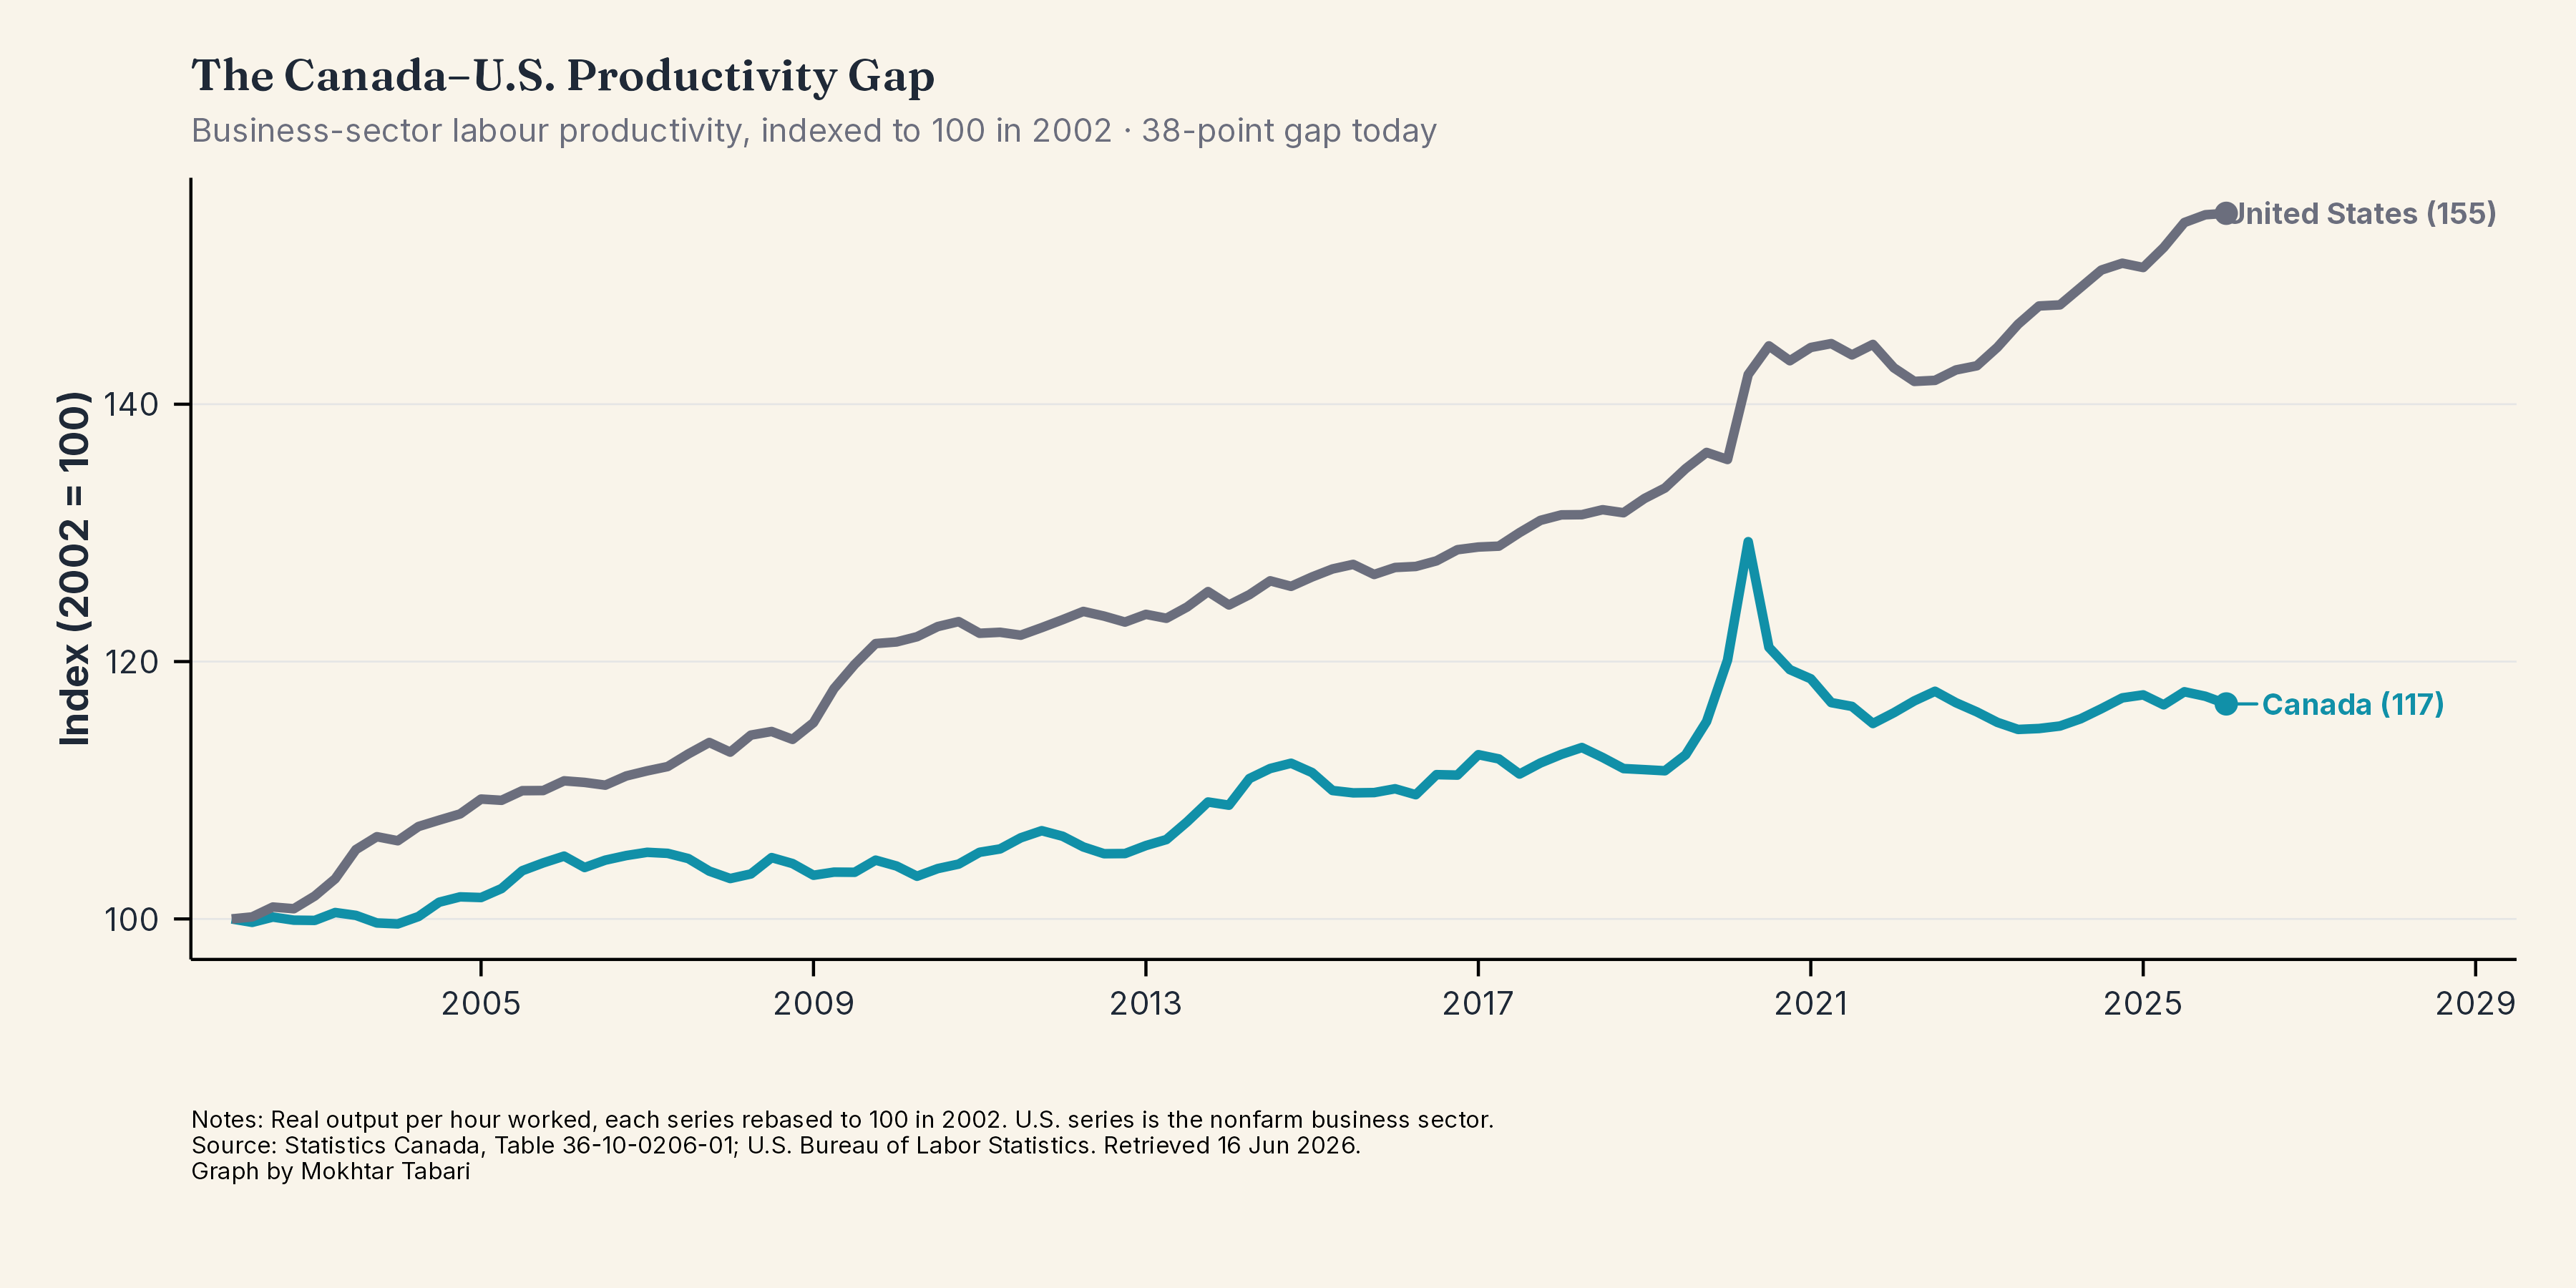
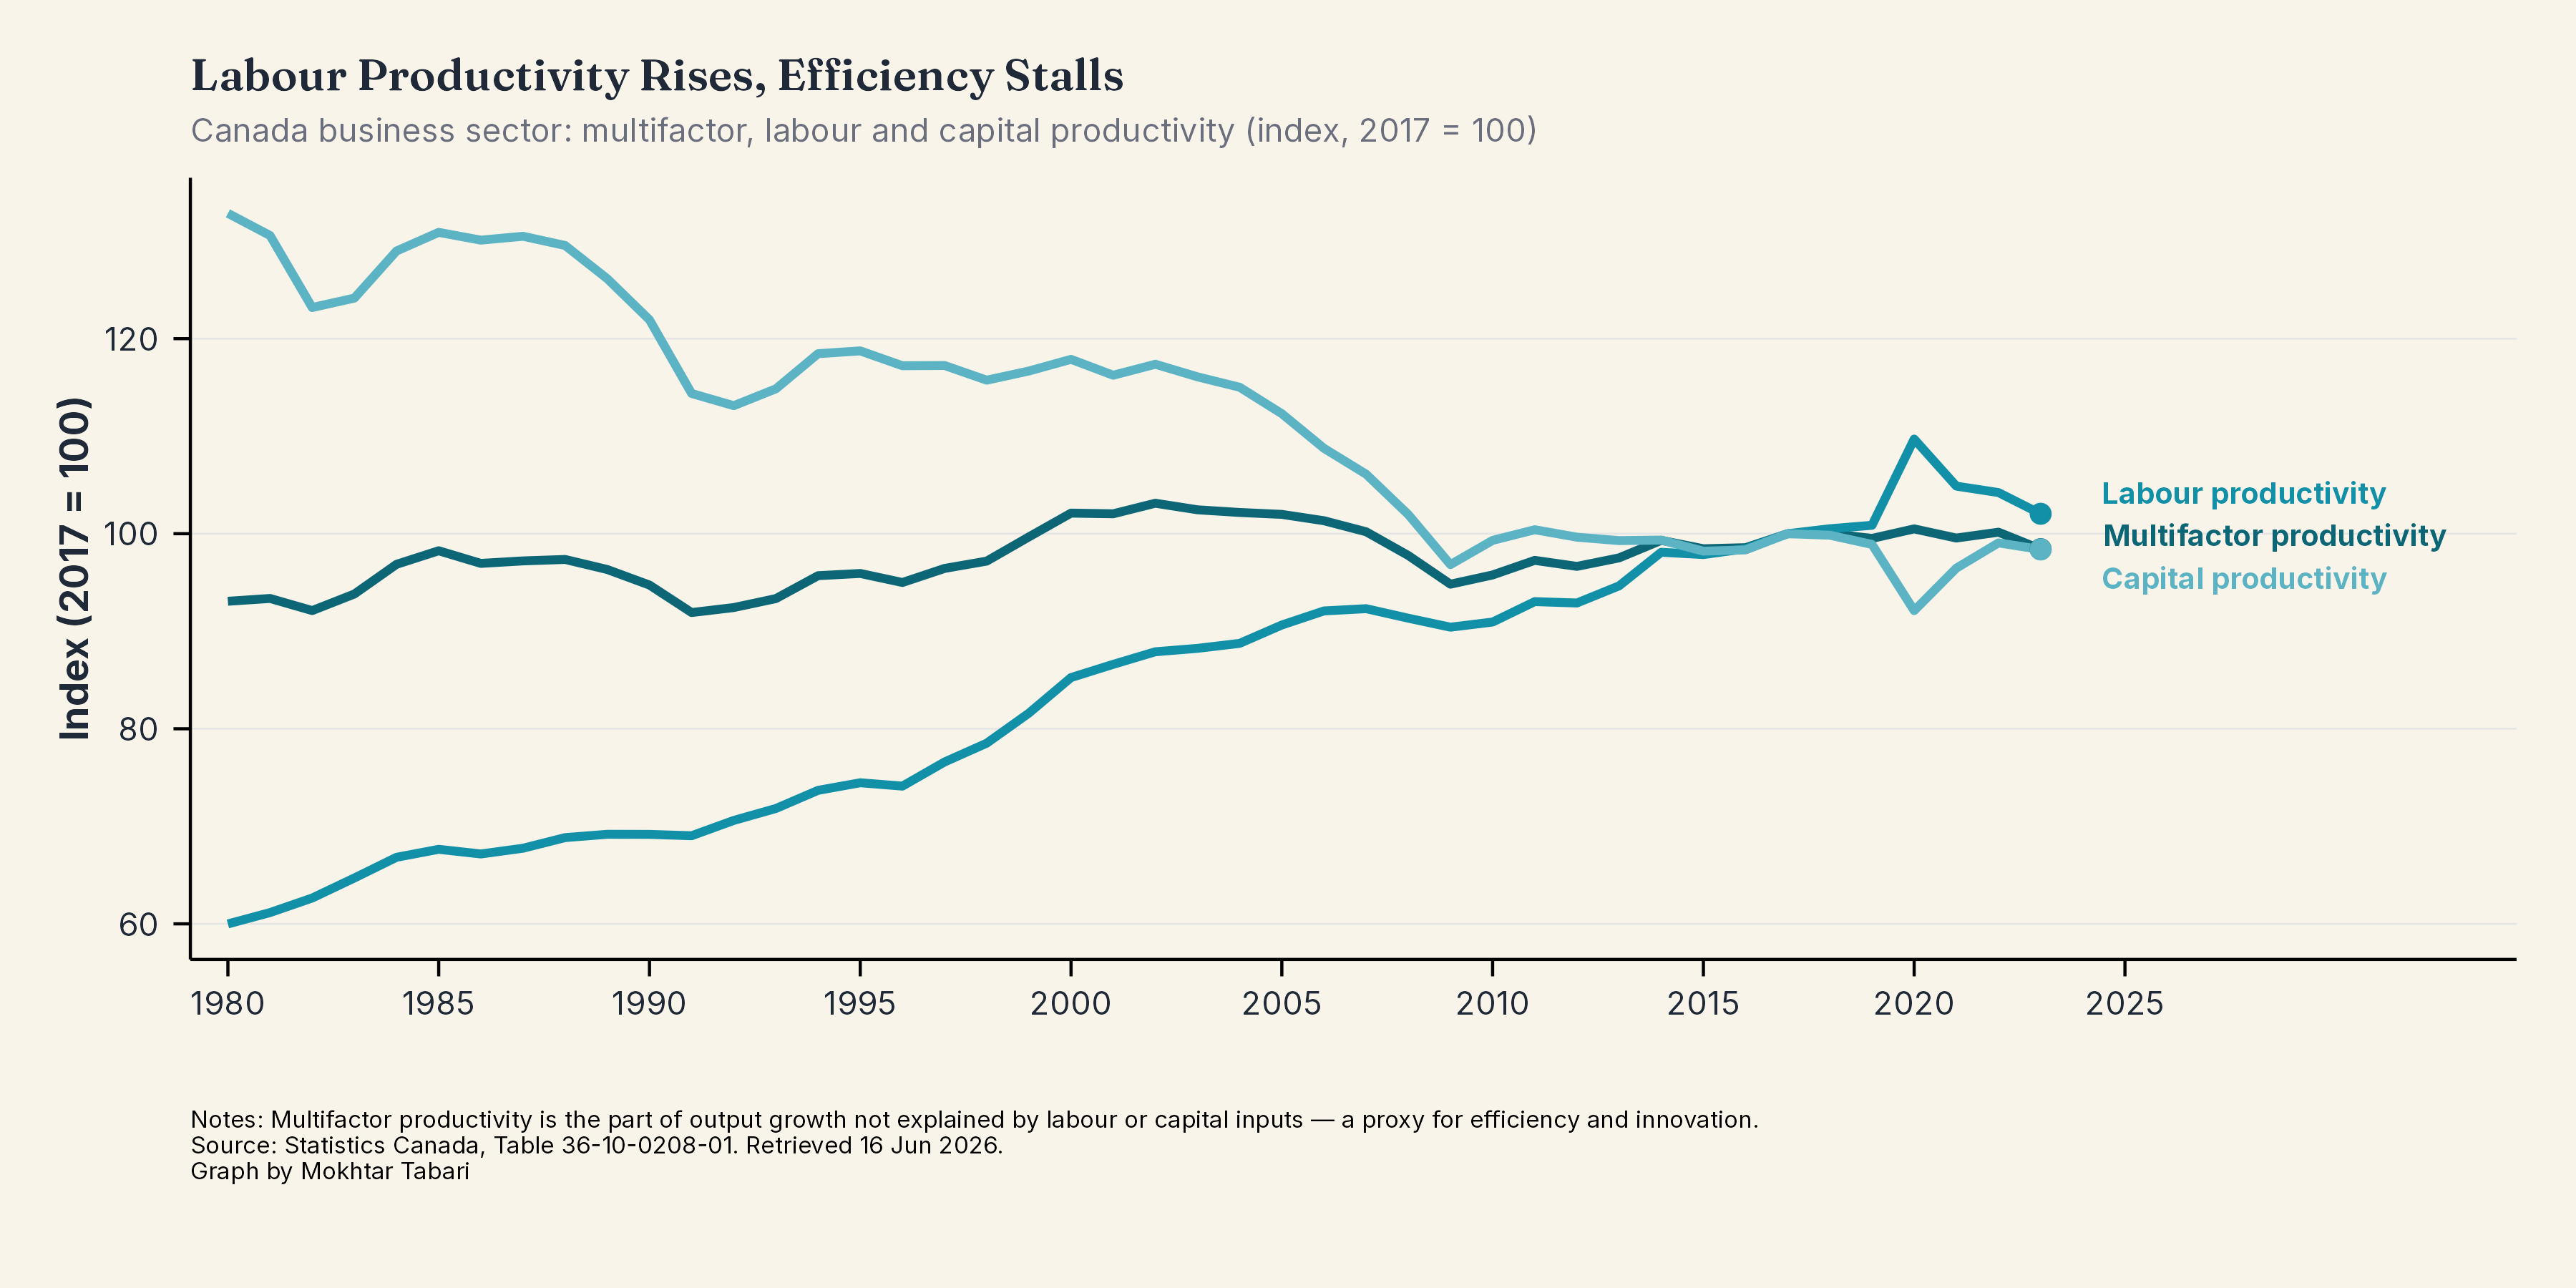
Productivity & Competitiveness
4 chartsLabour and multifactor productivity trends, investment patterns, and G7 competitiveness benchmarks.
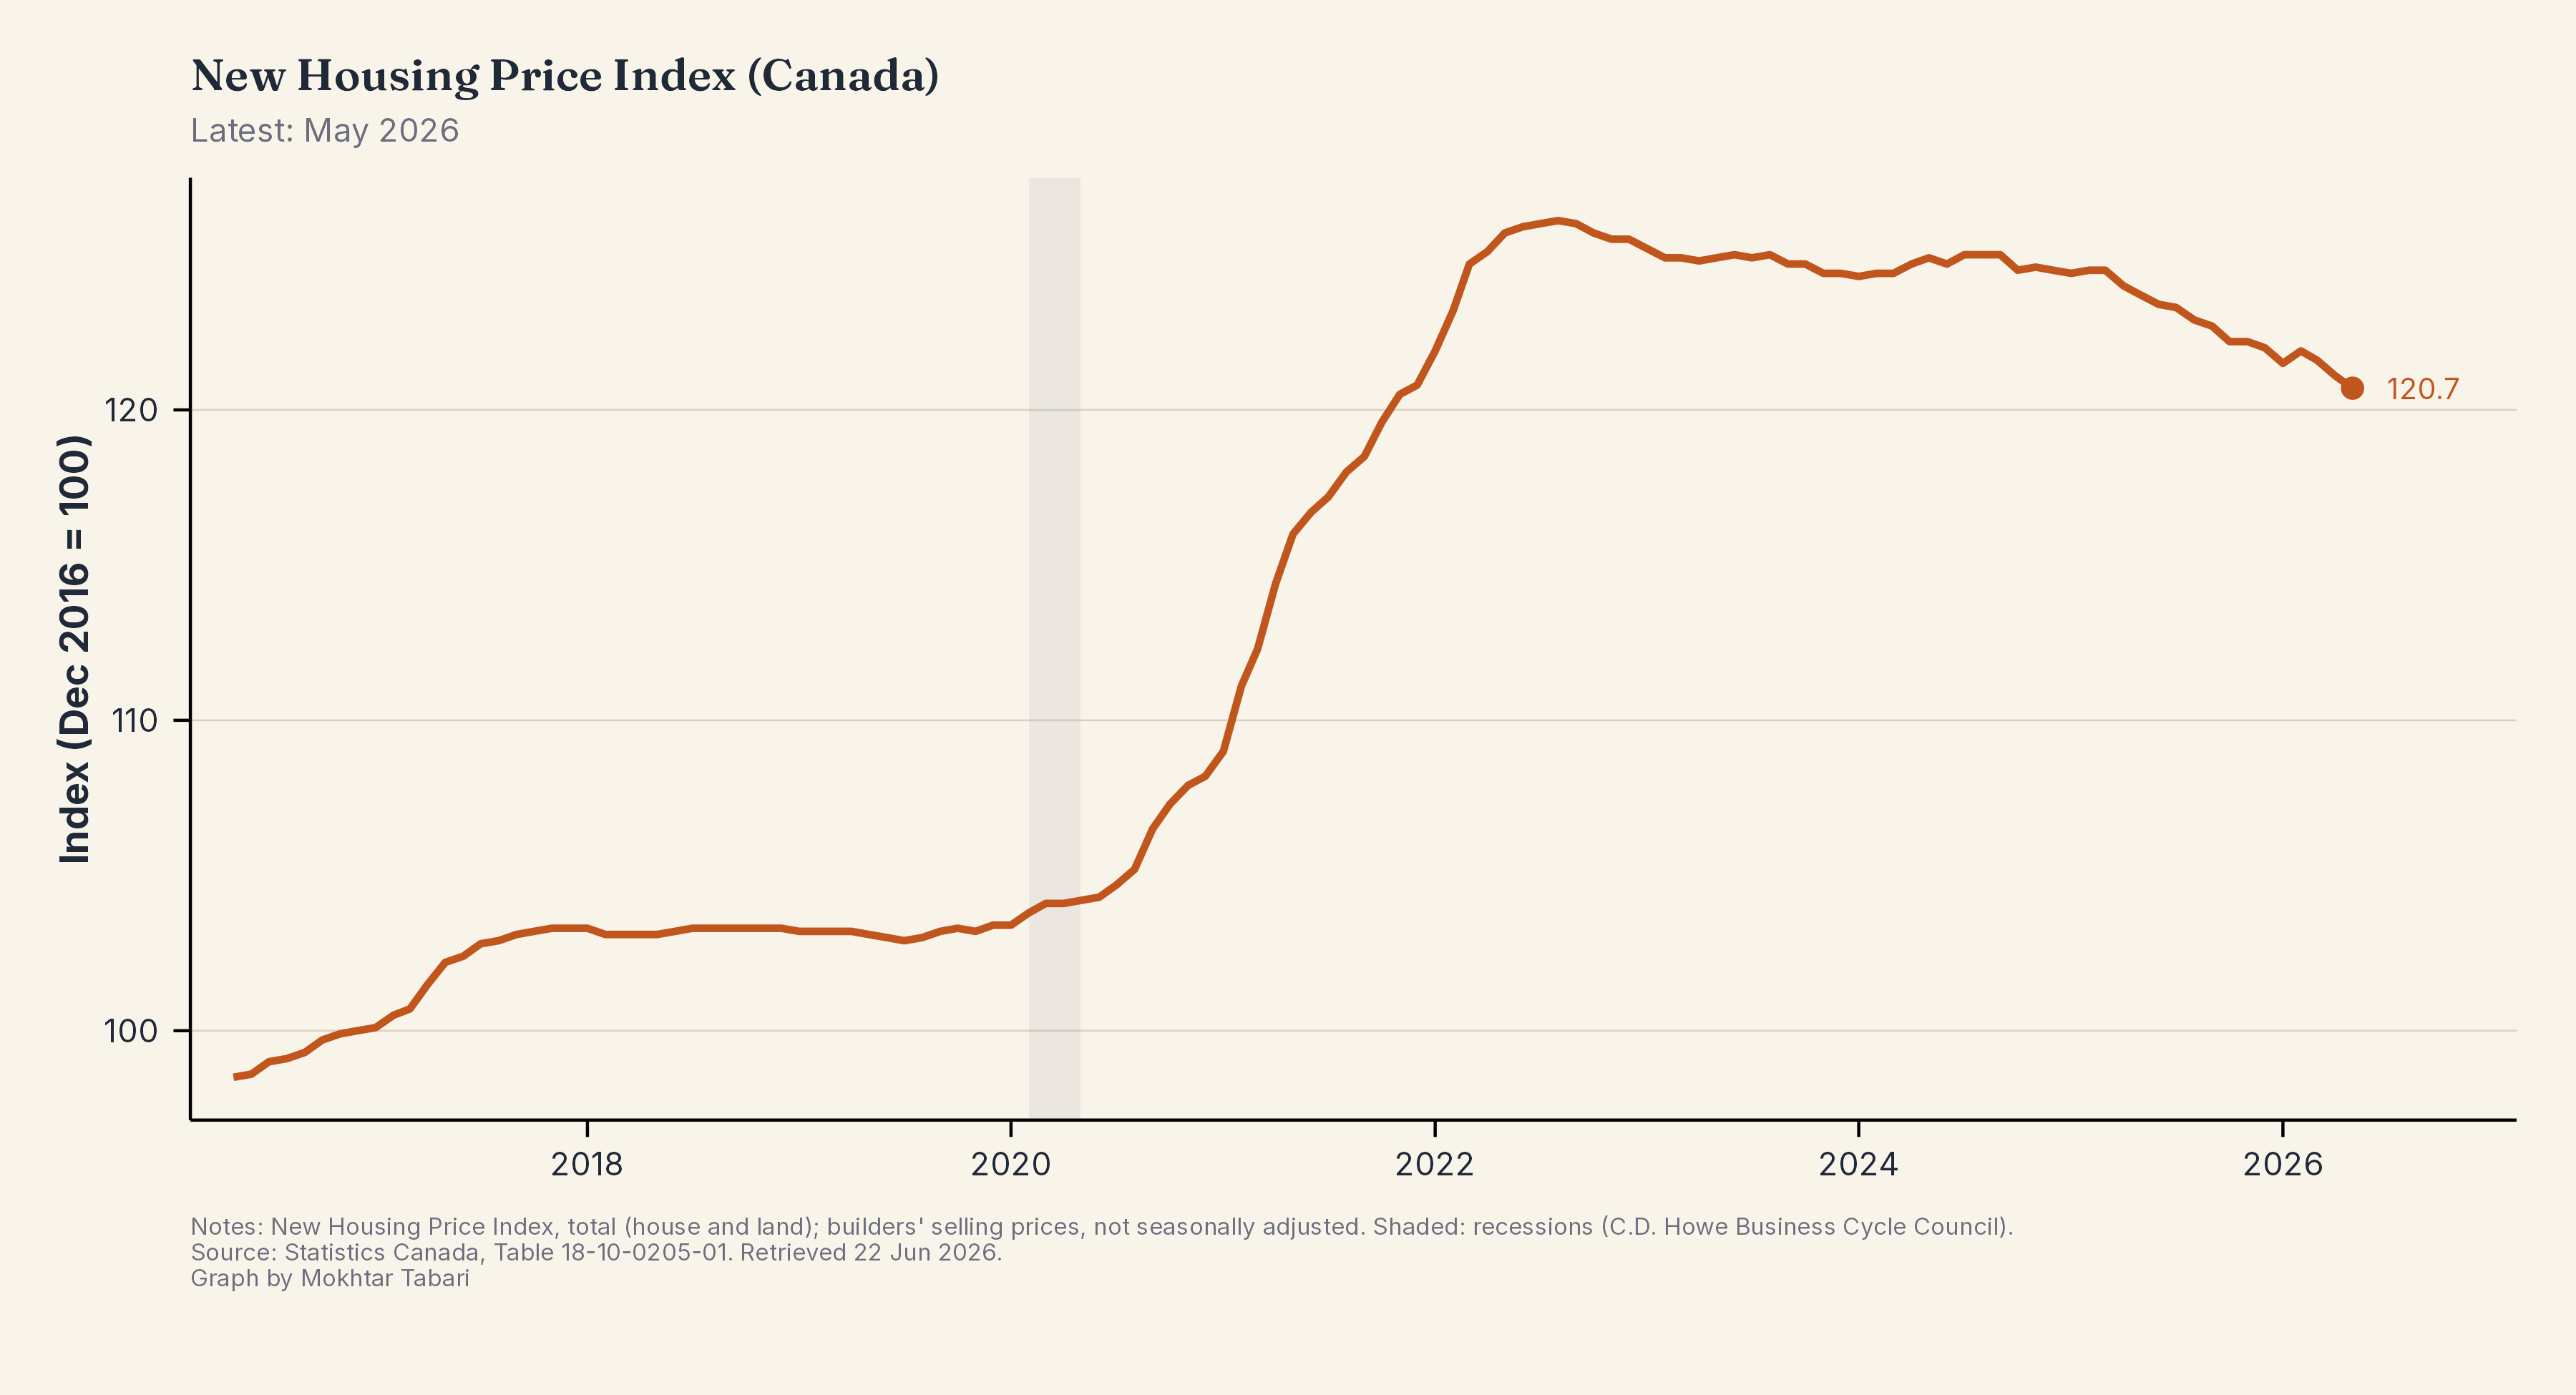
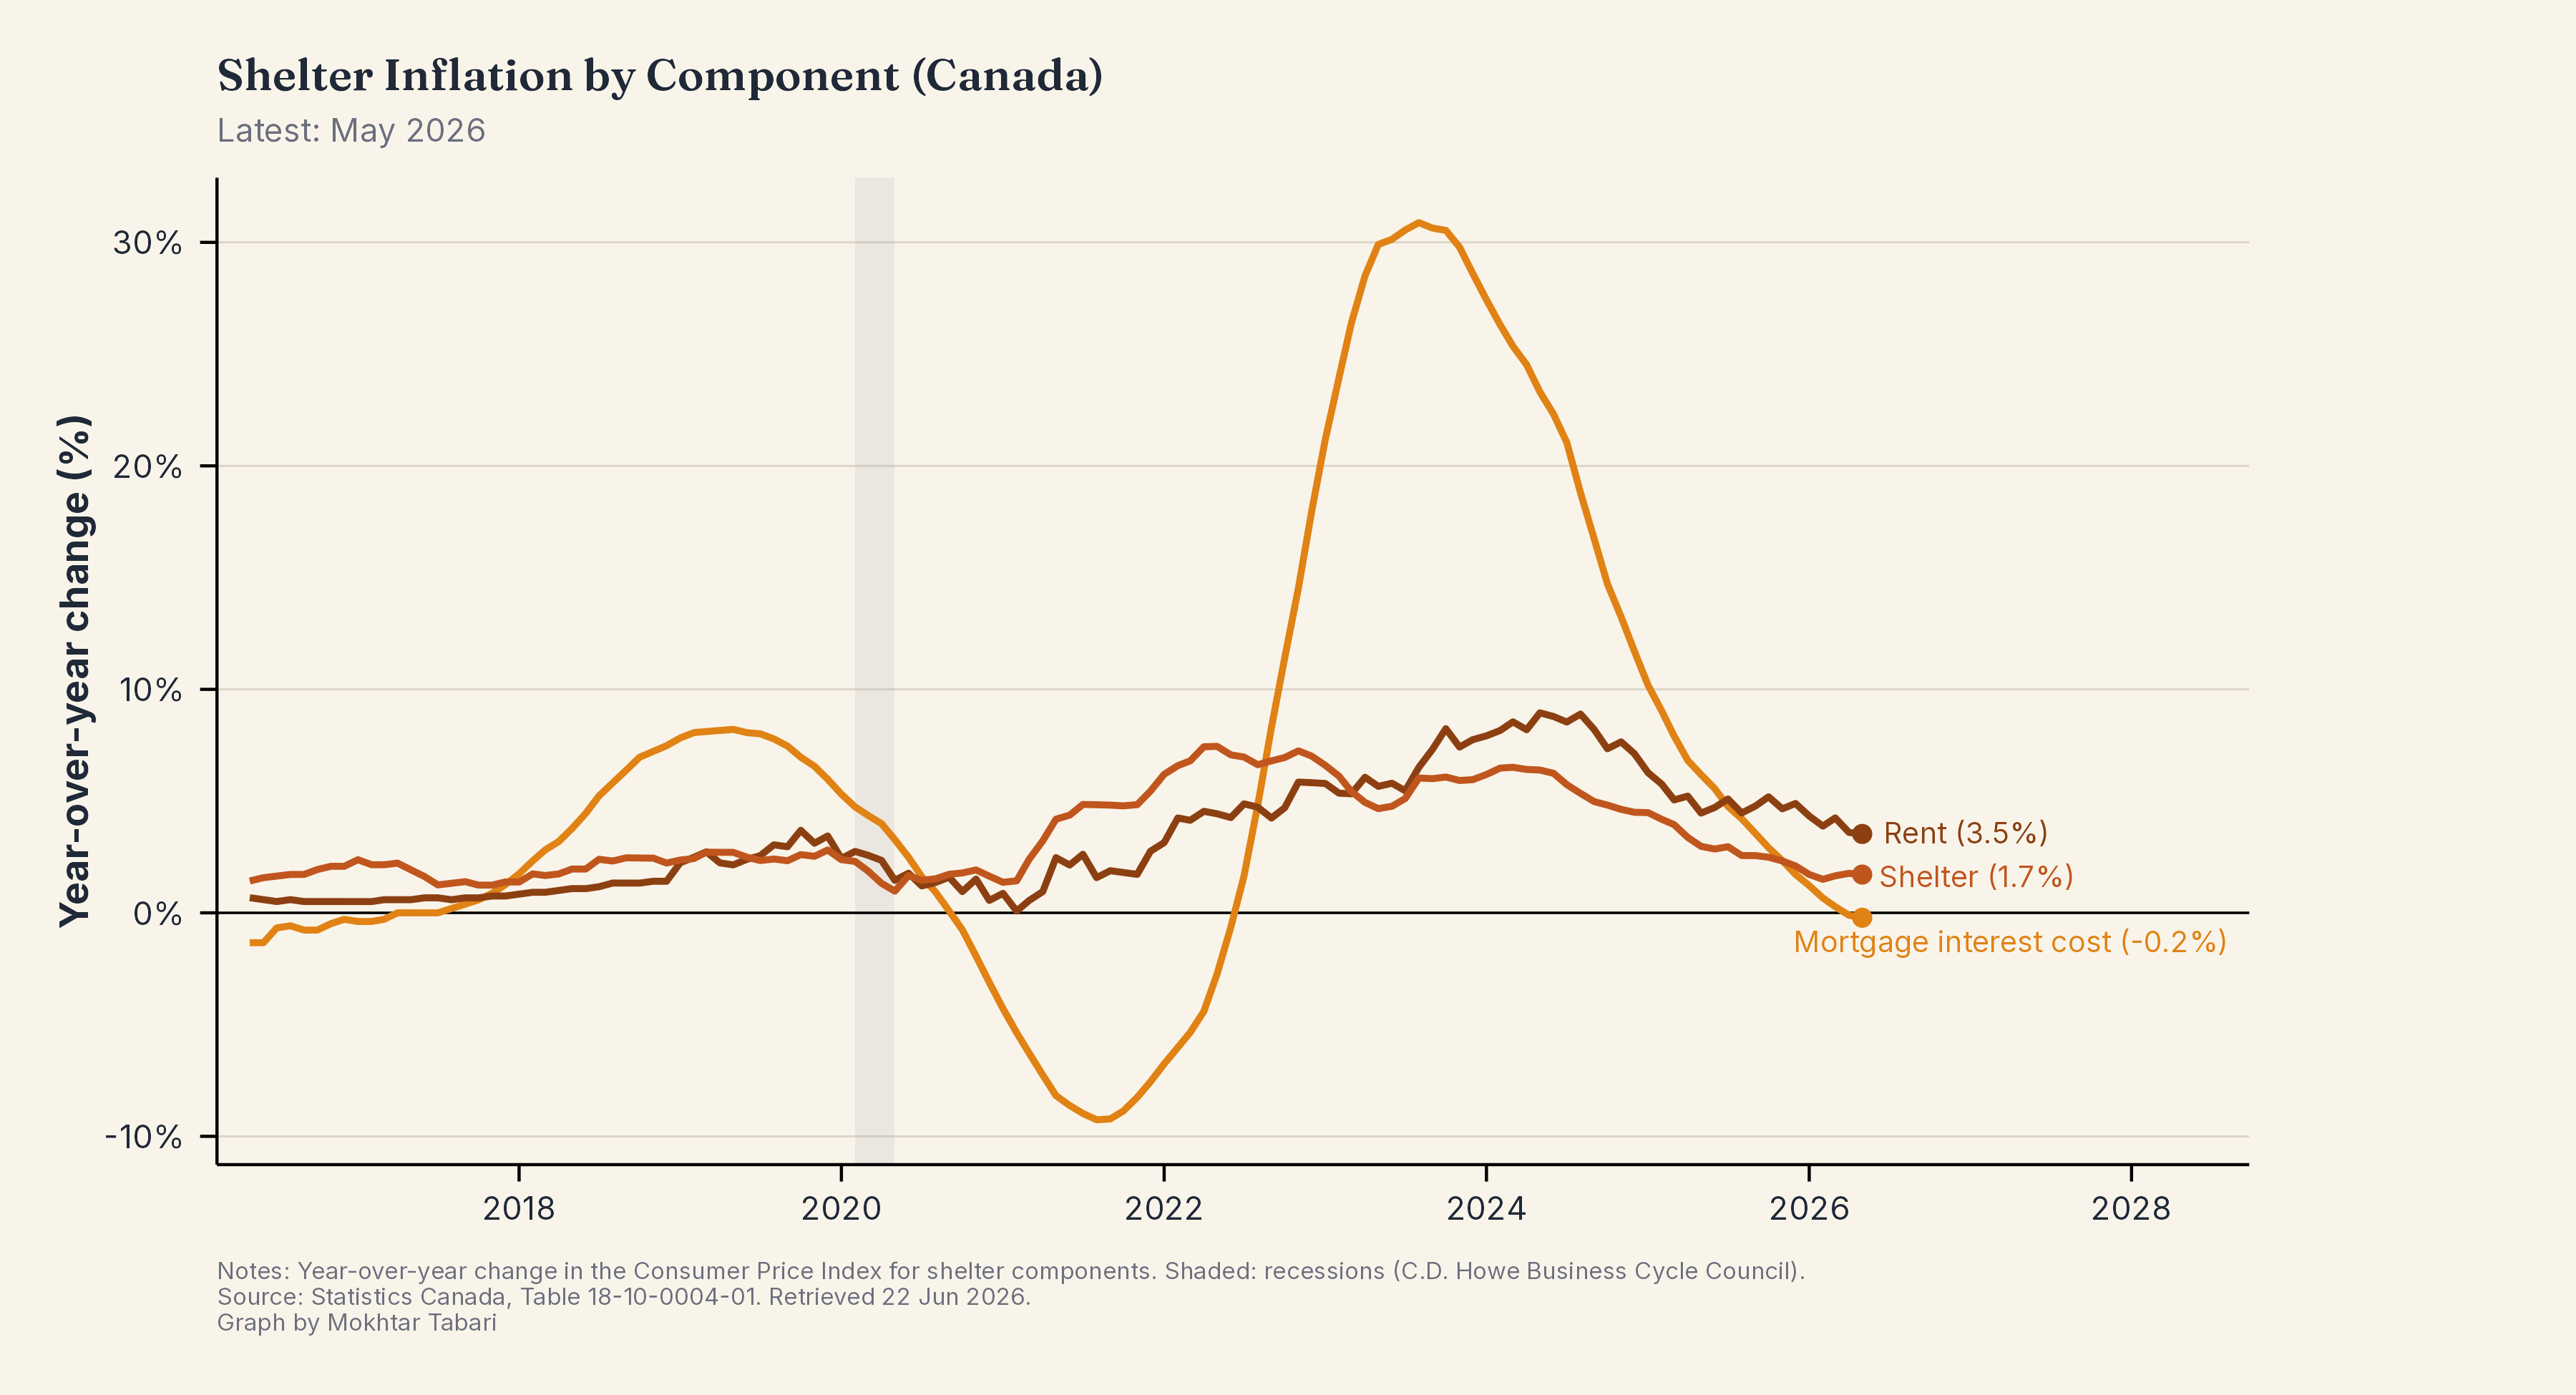
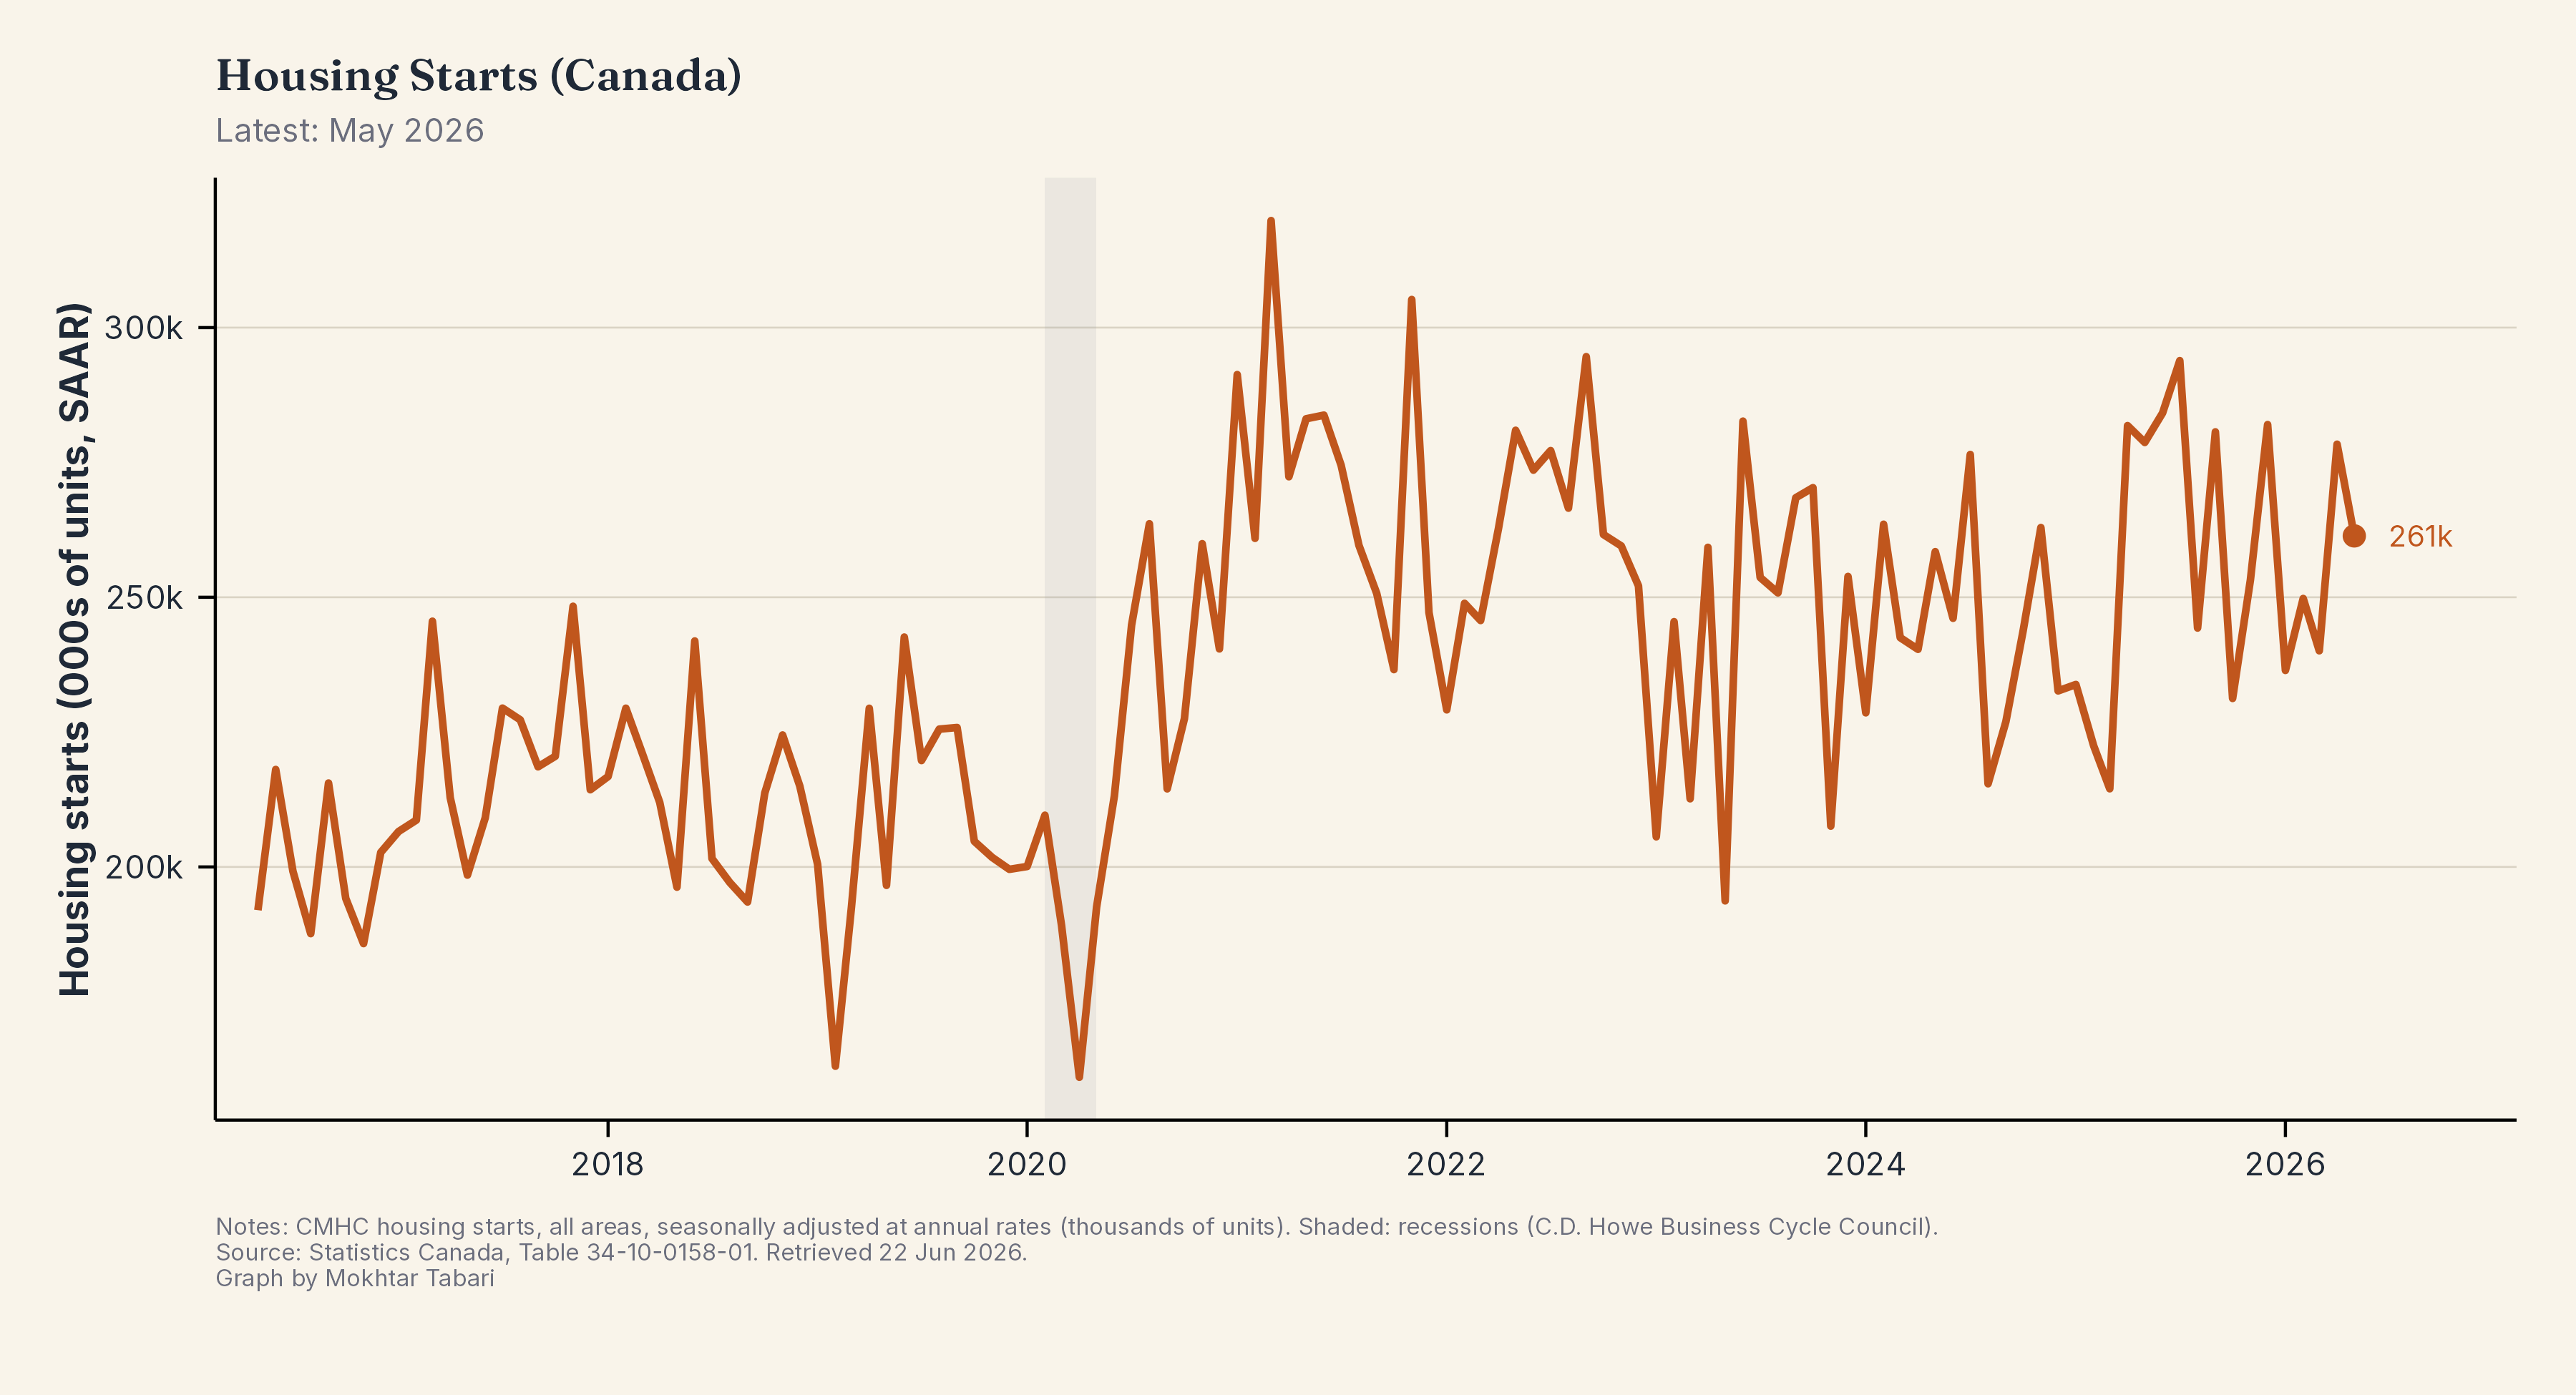
Housing & Affordability
3 chartsNew-home prices, shelter-cost inflation, and housing starts across Canada.
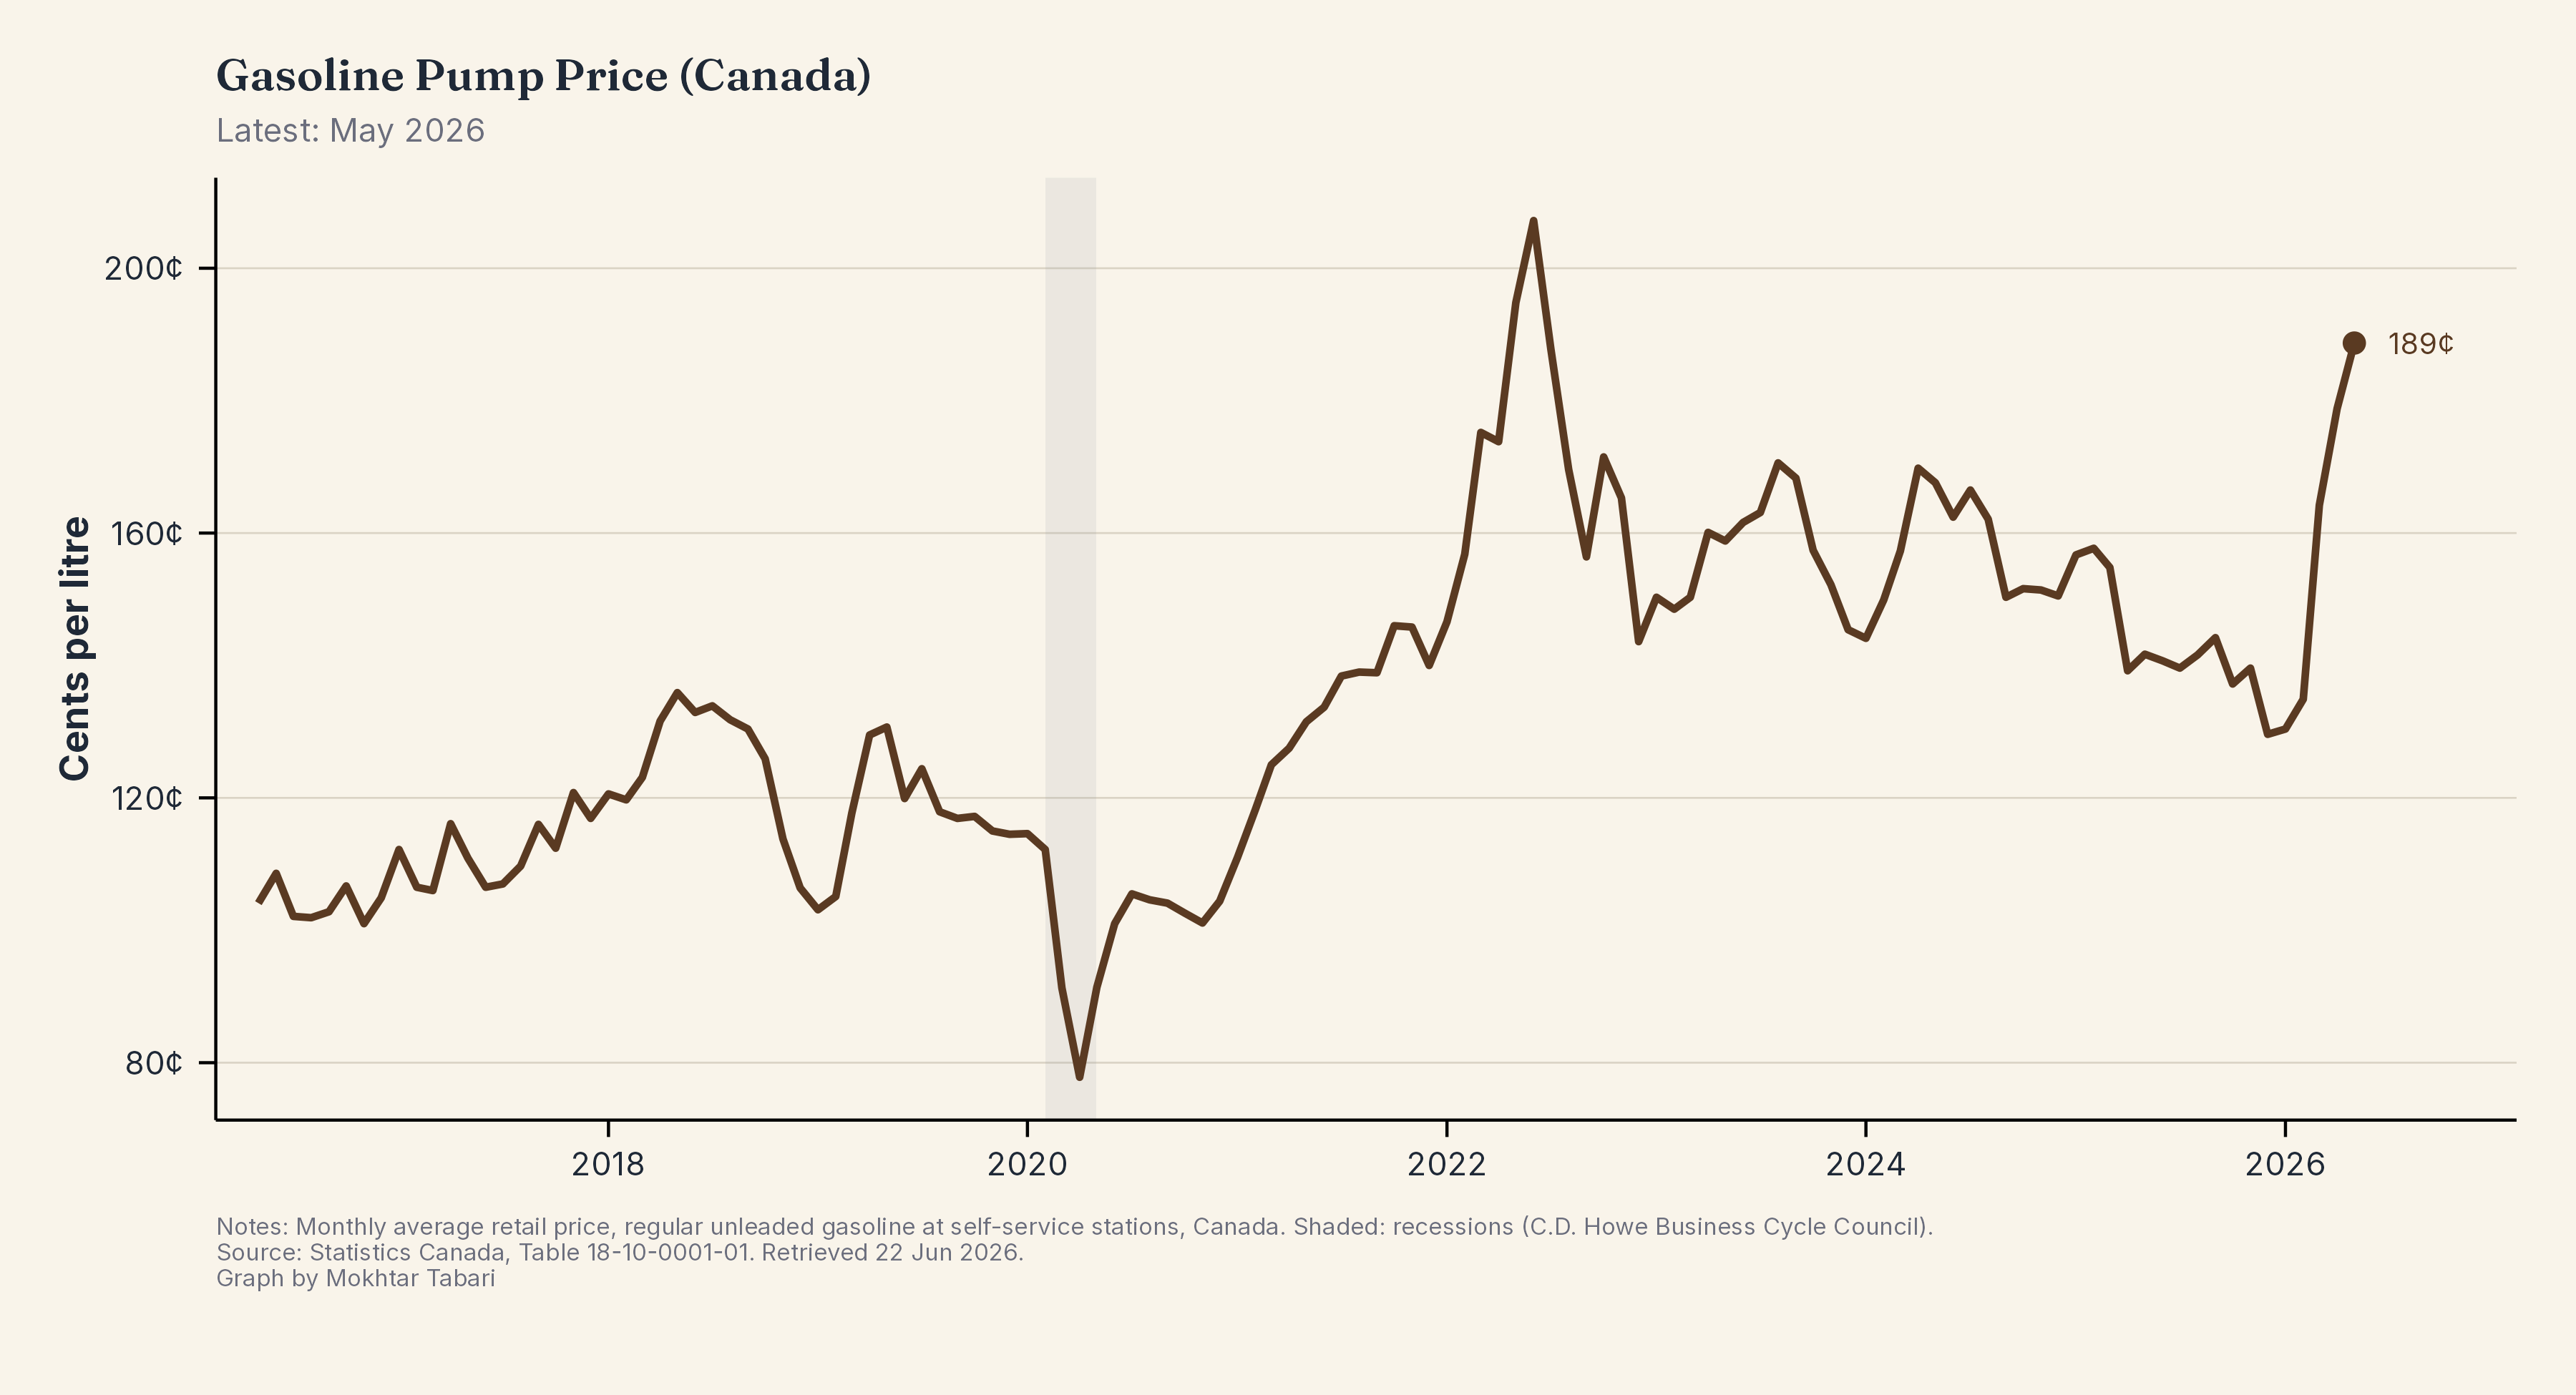
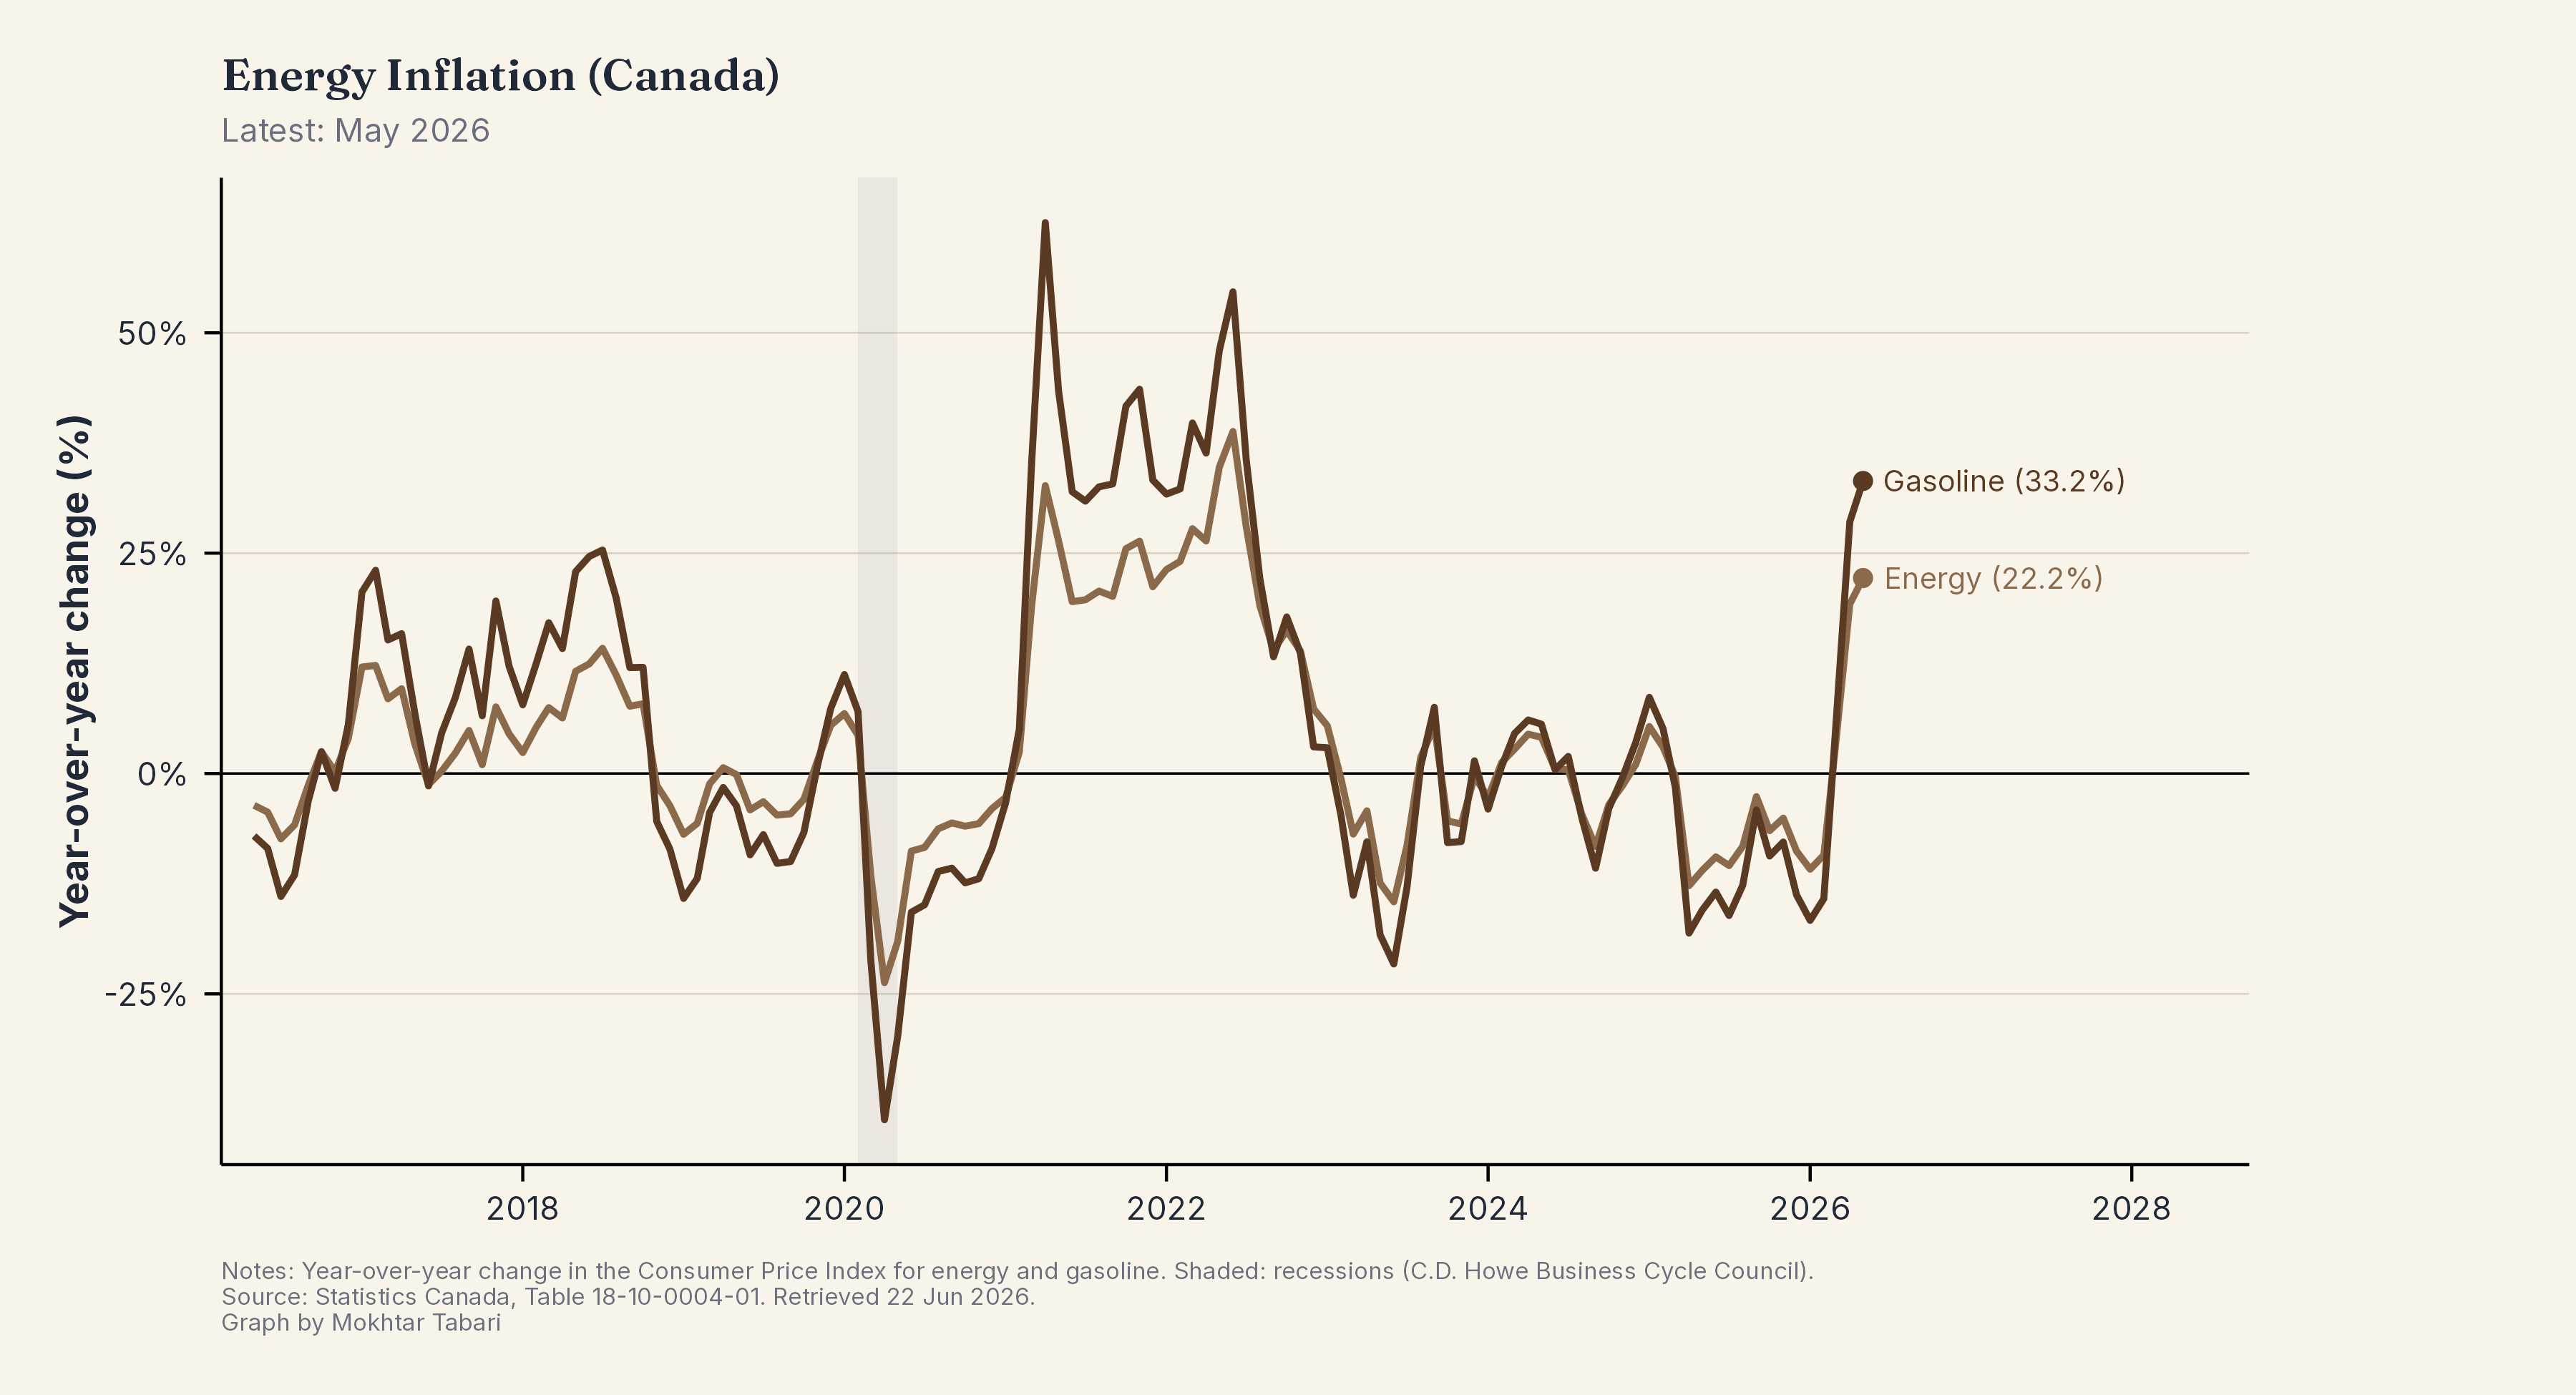
Energy & Gas
2 chartsRetail gasoline prices and energy-cost inflation across Canada.
About this data
All charts are generated programmatically from official and authoritative sources such as Statistics Canada , FRED , and Eurostat using R and custom ggplot2 styling. Code is open source — each topic page links to its source repository. Charts are automatically regenerated and deployed whenever new data is published.